08.08.2023
Digital twin on the edge: The x-factor
By Morten Kjeldsen, Managing Director, Flow Design Bureau AS, Norway
Digital Twins (DT) have been with us in the hydropower industry for quite some time. Loosely defined, they are numerical models of real-world objects and systems, where there is communication from reality to the model. DT can continuously analyze and provide increased understanding of reality, thus contributing to monitoring and condition control. When the digital twin is put on the edge, it becomes exciting. Continue reading to learn about digital twins, edge solutions, and the combination.
Traditionally, numerical models is used during design and parallelly used for validating solutions and even for sales purposes. After a component or system is established, the models are used for documentation, for example, to test conditions that cannot be replicated in a FAT or SAT (Factory Acceptance Test or Site Acceptance Test). Finally, the models can be used for troubleshooting to establish the cause of an observed undesired or unplanned effect. When the use of models occurs after a component or system is established, there must be a significant agreement between reality and the model. It is at this point that the model can be called a digital twin. For example, the turbine’s efficiency must change from estimated or guaranteed by the factory to the one measured in a warranty measurement following the applicable standard. In some contexts, the term virtual commissioning is used for digital twins put into operation. During commissioning, relevant parameters or inputs in the model should be checked, and deviations, such as stiffness in shaft bearings, must be corrected. This is done to ensure that the results from the analyses in a digital twin are realistic, reliable, and represent reality.
Edge analytics is the processing that occurs on raw data streams near the source. This can be the initial statistic analysis and downsampling. This is often called aggregation or data reduction. In addition, we can combine data to create a new parameter. For example, with measured leakage water flow (q) and temperature of the water (T, Leak and measured temperature on the water going through the turbine (T, turbine), the power loss (P) in the leakage flow can be calculated: P = rho * q * c,P * (T, Leak – T, turbine); where density (rho) and heat capacity (c, P) can also be calculated from known temperature and pressure. In principle, we now have a virtual sensor for P. The calculation of P can, in principle, occur at the same pace as values are delivered from sensors for the calculation of P.
A digital twin that runs on the edge is often referred to as xDT, or executable digital twin. To the extent that the original twin is based on a large 3D model, CFD (Computational Fluid Dynamics), or FEA (Finite Element Analysis), its xDT will be a reduced version. 1D models, where components are represented with their performance characteristics, can run unchanged on the edge. For hydropower plants, an xDT based on 1D CFD for the waterway will use reservoir levels and estimated water flow in inlet streams, together with the opening degree of the guide vanes, to calculate instantaneous and future(!) dynamics in the system. Such an xDT can be a virtual sensor and provide information about the system state in areas that are difficult to instrument. Typical examples are the instantaneous indication of the level in surge shafts and speeds in different tunnel cross-sections.
Above we give our definition of digital twins and edge analysis. When operating the digital twin on the edge we have an executable digital twin (xDT). From an xDT we can develop a virtual sensor that provides added insight into a process by continuously presenting information that is not measured directly. Furthermore, we have defined virtual commissioning as the activity of adapting the numerical model to the as-built physical object or system. All these terms form the basis for adding value to data-flows already existing in a power plant setting. By mastering all these efforts useful and lasting solutions can be made.
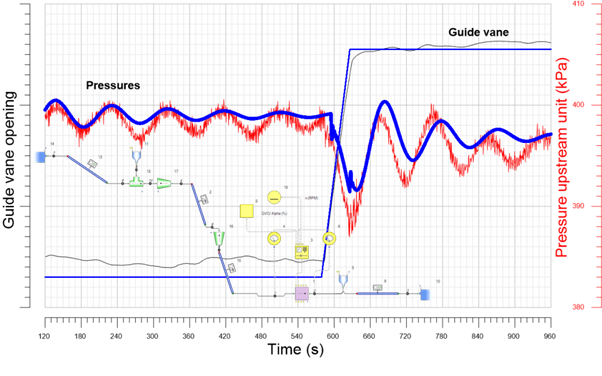
Fig 1 - Comparison between 1D CFD calculation, using nominal (not actual) cross-section areas of the water conduits/tunnels and the surge-shaft, and measurements. This is the model before virtual commissioning and therefore before the model is a real digital twin.
AFC4Hydro depends on powerful 3D fluid-structure numerical models to predict and optimize performance of flow control solutions for hydropower machinery. AFC4Hydro’s Work Package on structural health monitoring, led by Prof. Xavier Escaler from Barcelona Fluids & Energy Lab at UPC in Barcelona, develops Life-Expectancy-Models based on the measurement and 3D modelling of the machine dynamic response. These final life expectancy models will run on an edge device and as a digital twin or xDT. The AFC4Hydro project allows us to do careful virtual commissioning using expanded, and even extreme, measurement campaigns on prototype machinery.
Much of the terms used, such as xDT and virtual commissioning, were new to the author before participating in Siemens Software- Realize LIVE Europe in Munich in July 2023. Siemens invest time and effort into developing these topics and is a likely source of future inspiration for us working in the field. One of the partners in AFC4Hydro uses Siemens Simcenter Flomaster for designing auxiliary systems associated one flow control method investigated in our project.
Relevant link: Siemens on status and prospects of xDT
Five reasons why Executable Digital Twins are set to dominate engineering in 2023
Latest Posts
08.08.2023
27.05.2021
01.02.2021
07.01.2021
11.10.2020
07.09.2020
22.06.2020
17.04.2020
16.03.2020
21.01.2020
27.05.2021
Hydraulic Scale Modelling of Pumped Storage Plants
By Livia Pitorac, Flow Solutions Specialist, Flow Design Bureau AS, Norway
In May 2021 Livia Pitorac joined the staff of Flow Design Bureau, one of the AFC4Hydro partners, and she will be the FDB responsible for WP2 activities at the various sites of the project. Livia came from a PhD candidate position at NTNU, within the Norwegian Research Centre for Hydropower Technology (HydroCen) before joining FDB. Her work concentrated on numerical and experimental work on hydropower dynamics all of which is relevant to AFC4Hydro. This blog post introduces her work at NTNU.
Among the energy storage options, pumped storage plants historically and currently excel both in stored energy volumes and in power capacity. However, considering the high costs of developing new large-pumped-storage projects and the environmental and social aspects, an environmentally and socially preferable solution is to redesign existing hydropower plants and upgrade them to pumped storage plants. With the use of hydraulic scale modelling, challenges, limitations, and possible solutions for such upgrade can be analysed. Hydraulic transients are more complex in a pumped storage plant compared with a conventional hydropower plant. This applies especially in Norway, where many tunnel systems are long and complex owing to the topography. The design and scaling criteria of the model, and preliminary findings from this ongoing research project are analysed.
PROTOTYPE
The Roskrepp hydropower plant, equipped with a 50 MW Francis turbine and an 83 m gross head, has been chosen as the prototype to be used for scale modelling. The longitudinal sketch of the Roskrepp HPP in the figure below shows the hydraulic system composed of a headrace and a tailrace tunnel.
The hydraulic system features:
① brook intake,
② two-chamber surge tank,
③ surge shaft with expansion chamber,
④ unplugged adit.

Fig 1 - Longitudinal sketch of the Roskrepp HPP
Based on the prototype, a 1:70 hydraulic scale model was developed at the Hydraulic Laboratory at NTNU. The model is tuned against field measurements performed on the prototype.
The hydraulic scale model tuning is done using the turbine inlet and outlet pressure from the field measurements and the singular loss parameters determined with the help of numerical models. For the steady-state adjustment of the head losses, the results from the numerical models are used to adjust the total head loss on each relevant tunnel section. For the transient tuning, an innovative method is used for adjusting the throttle of each surge shaft.
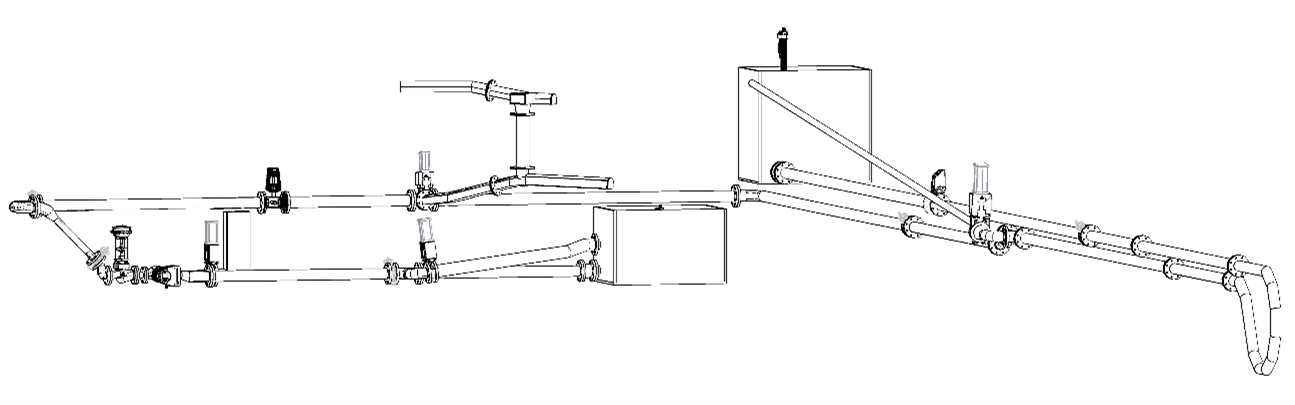
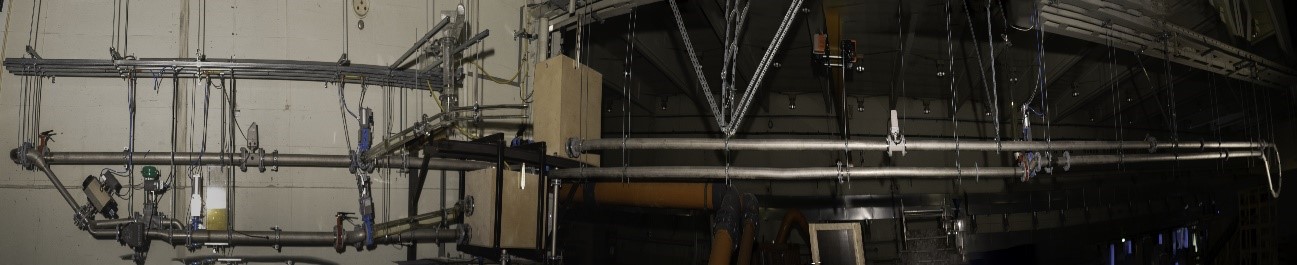
Fig 2, 3 - Hydraulic scale model developed at the Hydraulic Laboratory at NTNU.
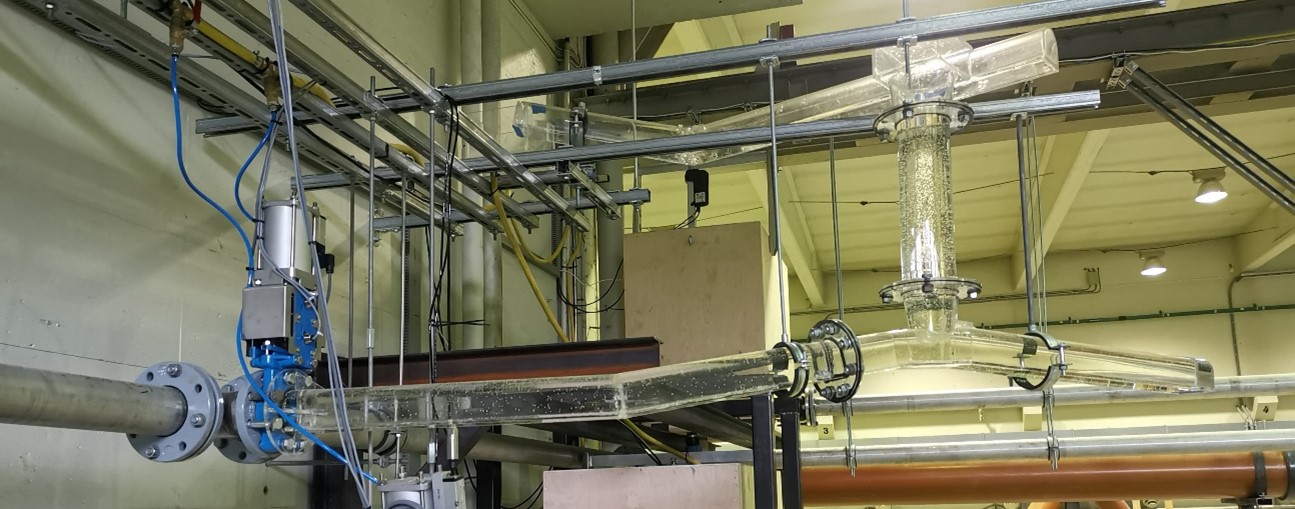
Fig 4 - Model of the two chamber surge tank along the headrace tunnel.
Figure 5 shows that a good agreement between the prototype and the hydraulic scale model is obtained using the various tunning methods. The results show up to 99% accuracy of modelling the damping, amplitude, and period of the mass oscillations. The model can be used for analysing tunnel system response in hydropower plants and pumped storage plants.
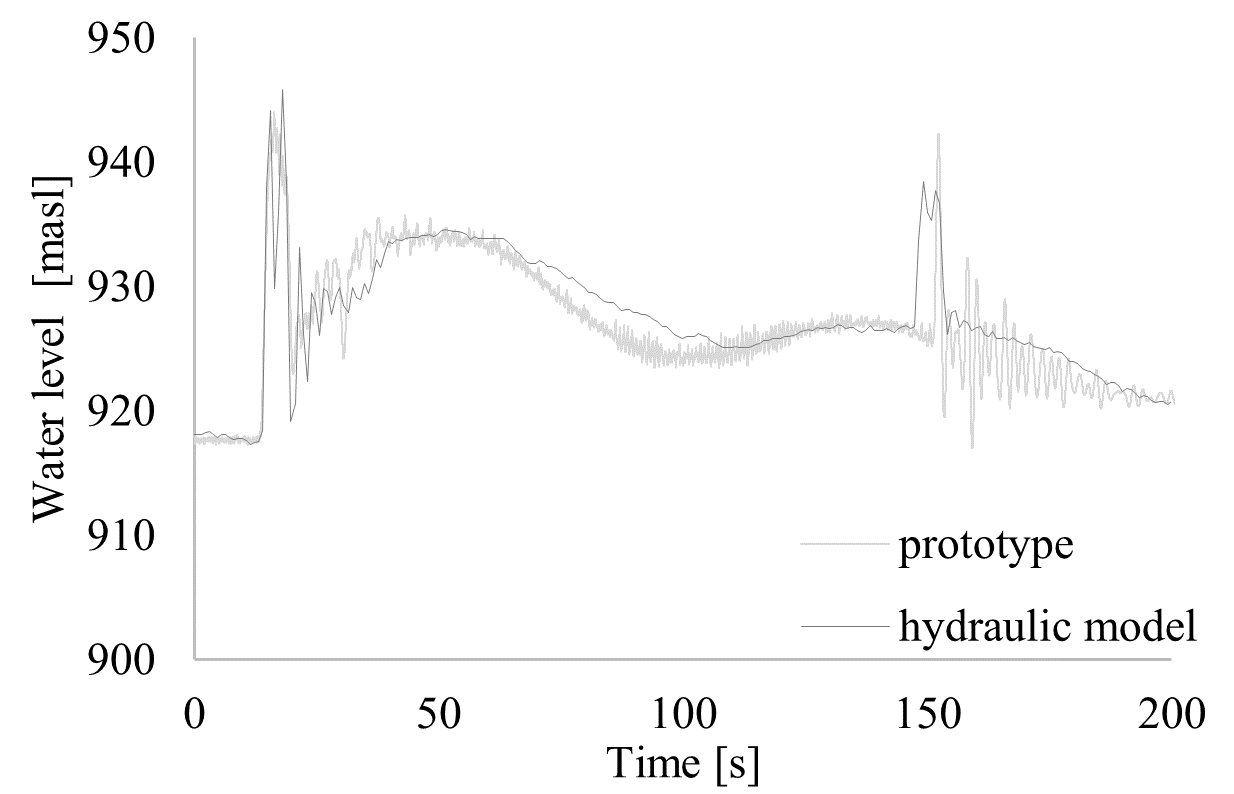
Fig 5 - Comparison between the prototype and the hydraulic scale model
This research is financed by and conducted as a part of the Norwegian Research Center for Hydropower Technology (HydroCen), www.ntnu.no/hydrodcen. Field measurements are obtained with the help and support from Sira-Kvina hydropower company. The work is done under the supervision of Leif Lia, Kaspar Vereide, and Michel Cervantes.
The AFC4Hydro project aims at developing technologies that improve the performance of rotating machinery at unfavorable operating conditions and including transients. The knowledge of transients in water conduits that Livia brings into the project will improve our physical modelling of relevant systems when designing our solutions.
01.02.2021
3D Modelling in Mechanical Design
By Claudia Pia, Product Designer, Flow Design Bureau AS, Norway
3D modelling allows us to design precise and custom solutions for each connected facility
With the use of 3D CAD programs and thanks to the indications provided by our partners, it has been possible to recreate a virtual model for each test rig where AFC4hydro is going to test its models.
This not only allows us to better understand the dimensions and spaces we have available for the design of customized solutions, but also gives us the ability to quickly visualize and compare different ideas that can be applied on the test rigs.
3D modelling tools facilitate this initial concept phase and make it possible to foresee potential assembly weaknesses, study the mutual movements of parts and find the best ways to easily assemble all the components.
ICM Design
More specifically, we are adapting Injection of Continuous Momentum (ICM) and injection of pulsating momentum (IPM) technologies, for the mitigation and control of pressure pulsations, to the laboratories in Luleå and Älvkarleby, in smaller scales, and on prototype turbine units in Porjus and Oksla.
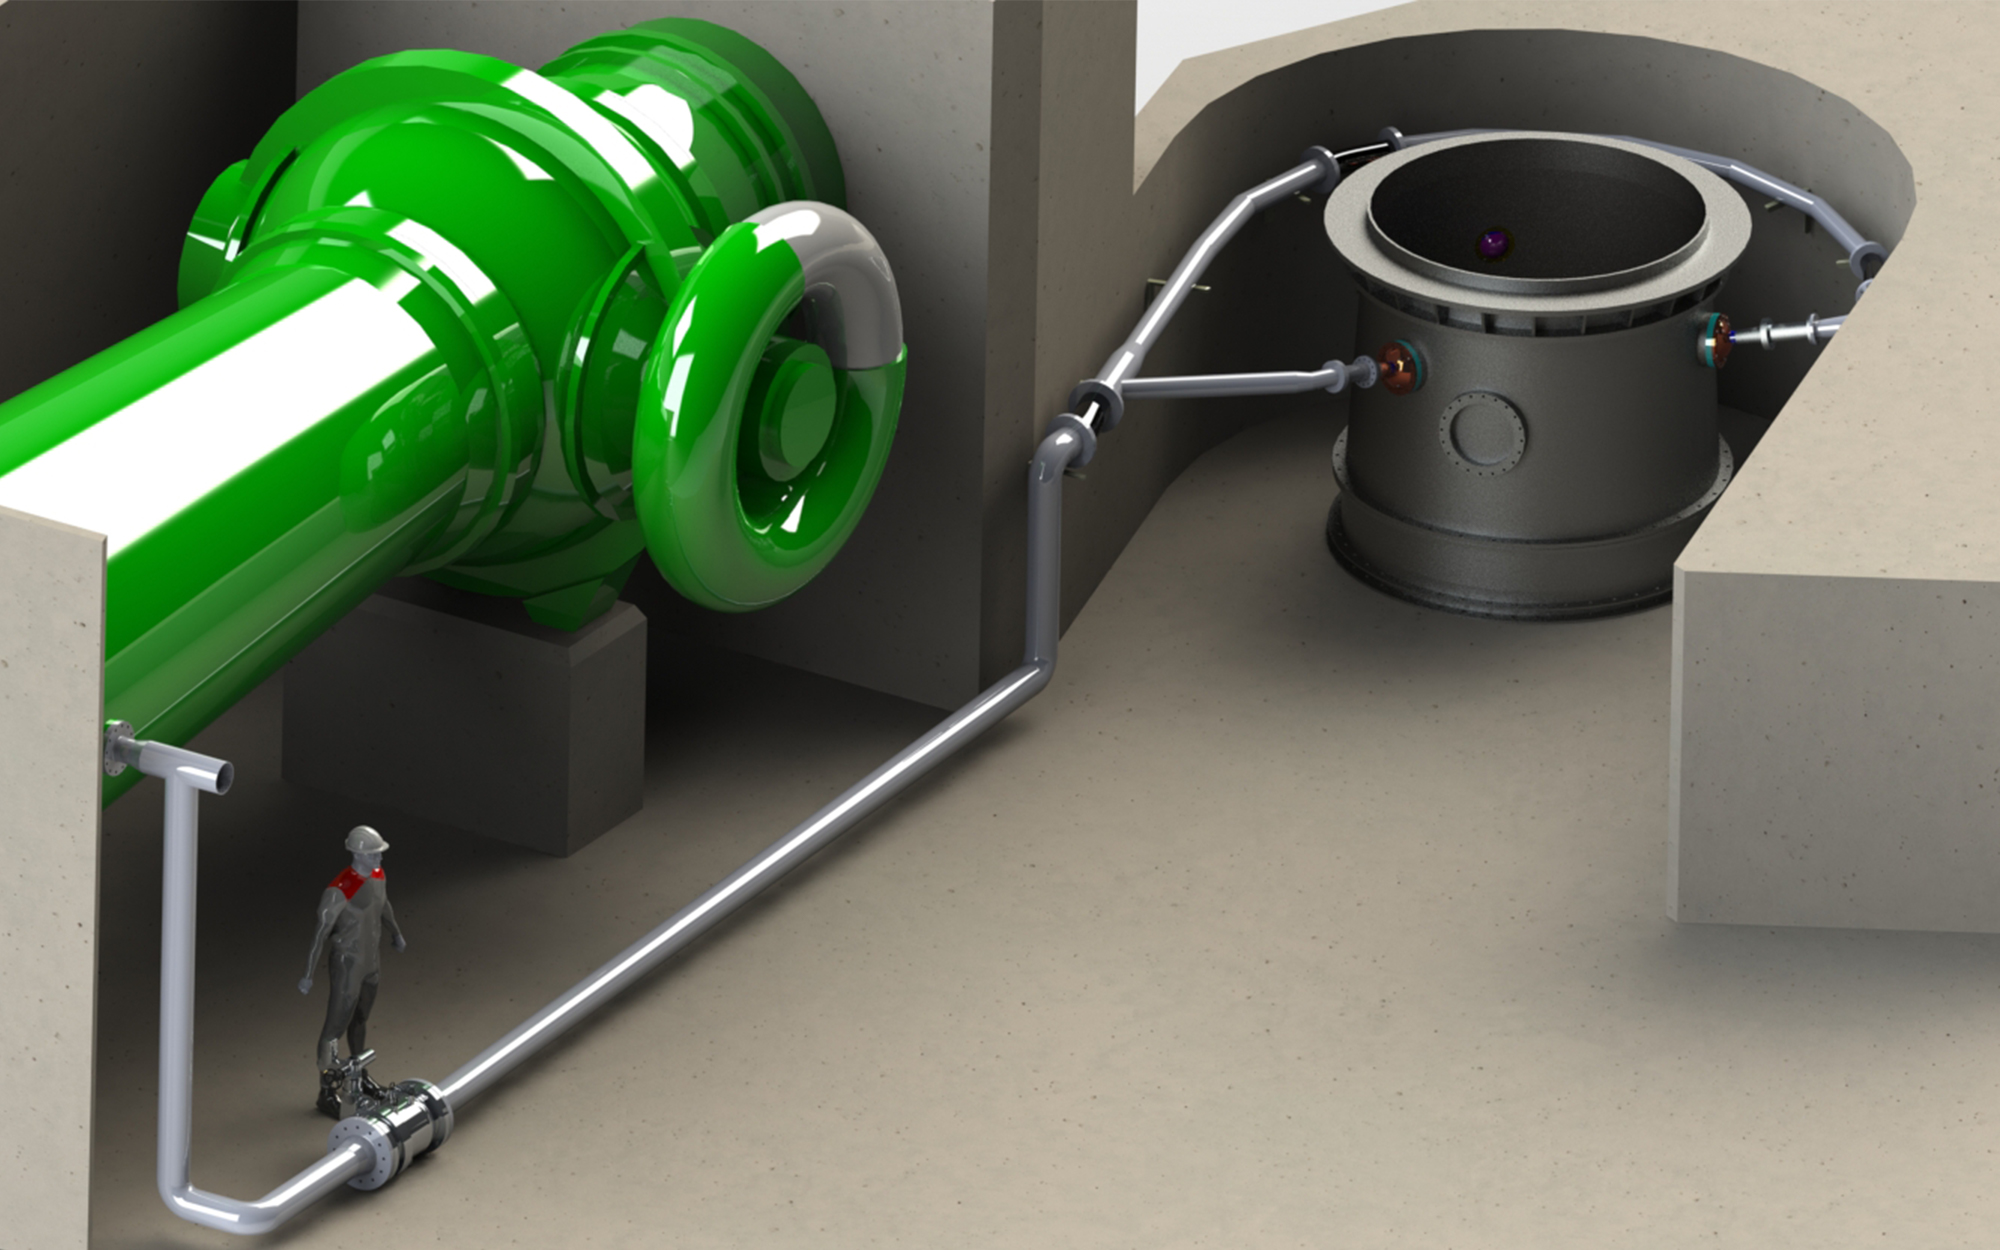
Fig 1 - Oksla Power Plant
Fig 2 - Porjus Power Plant
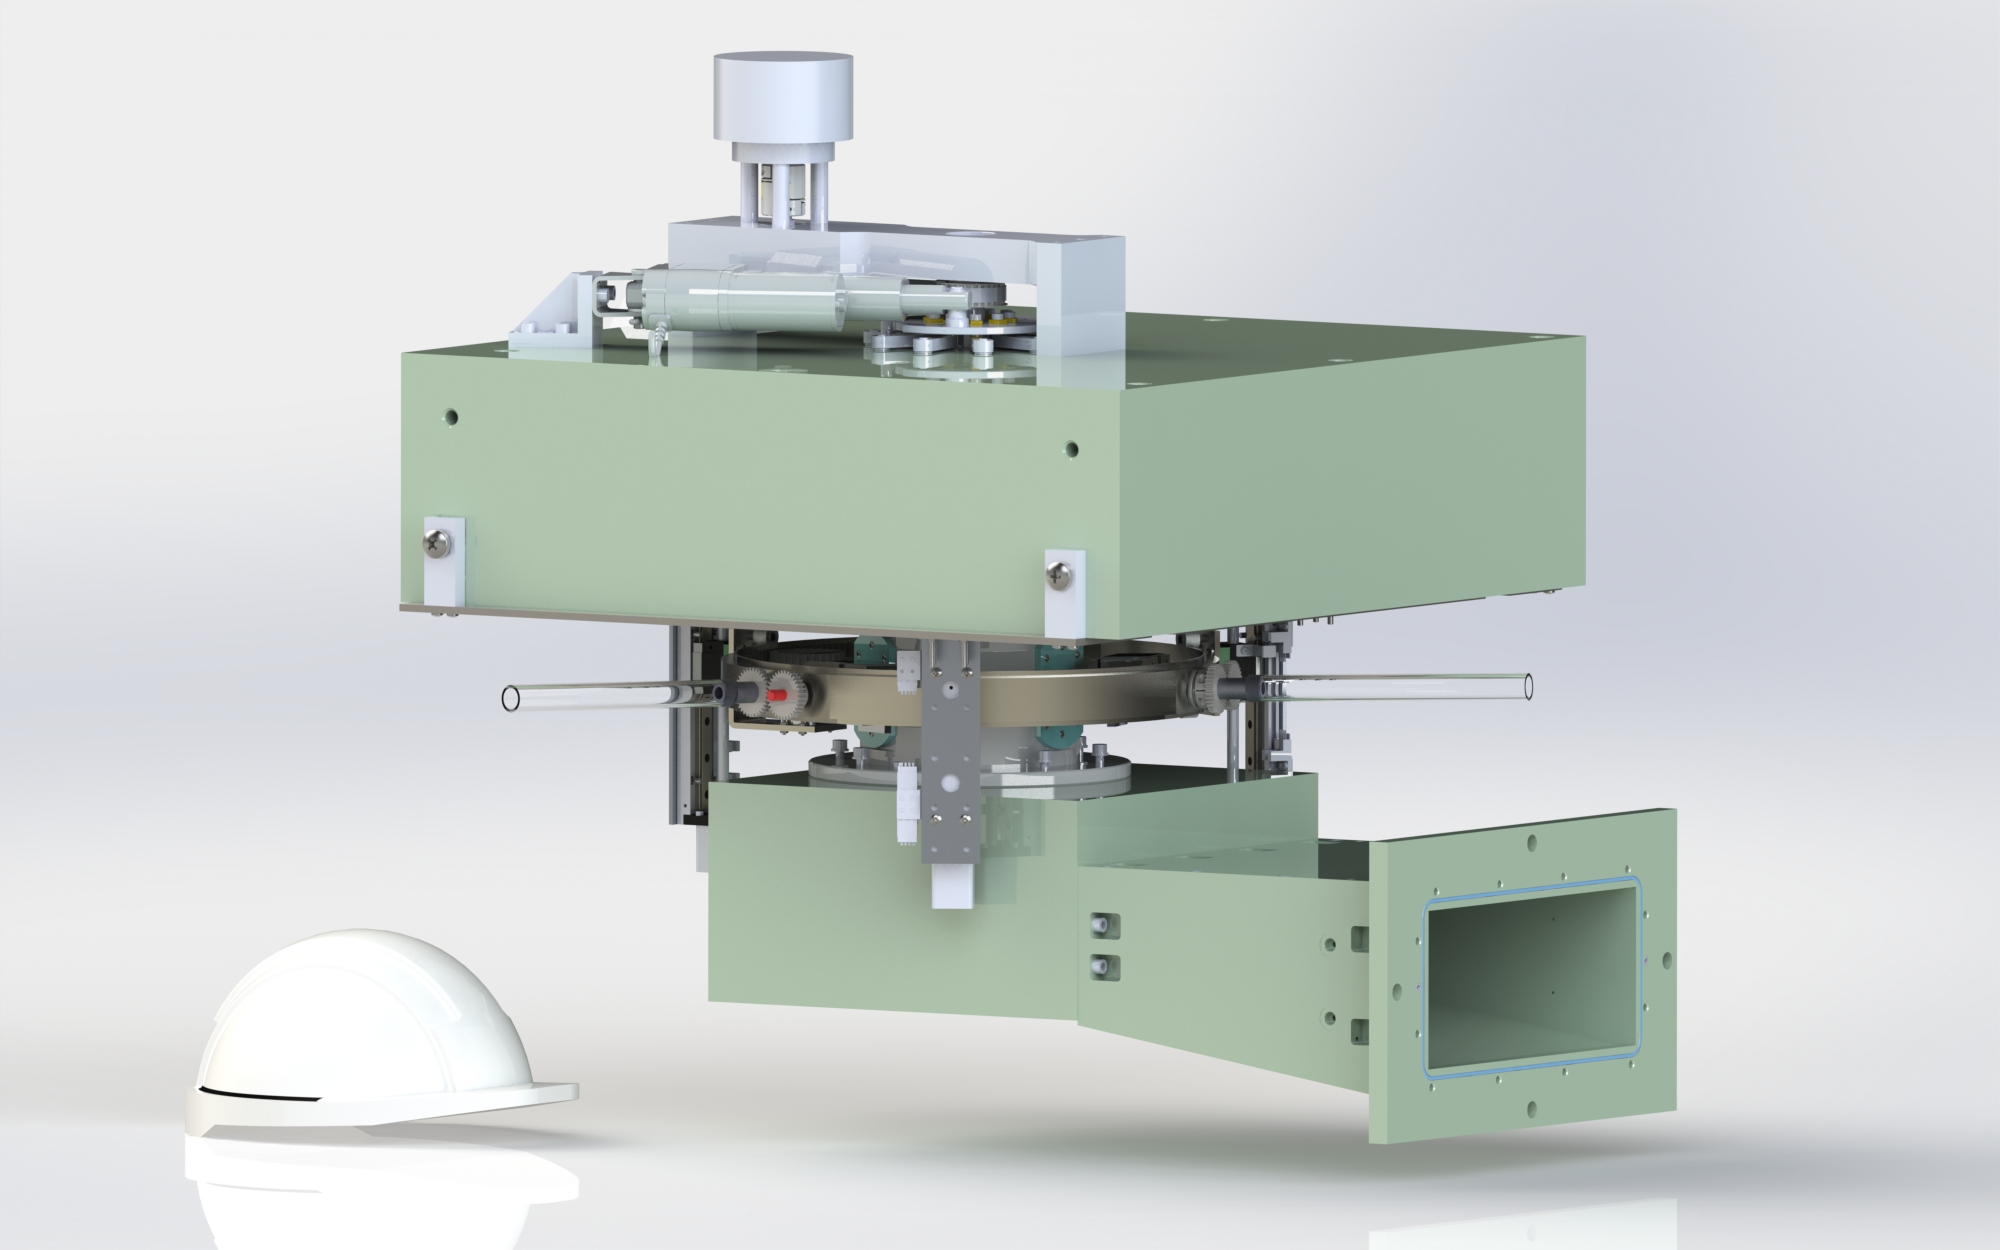
Fig 3 - Luleå Test Rig
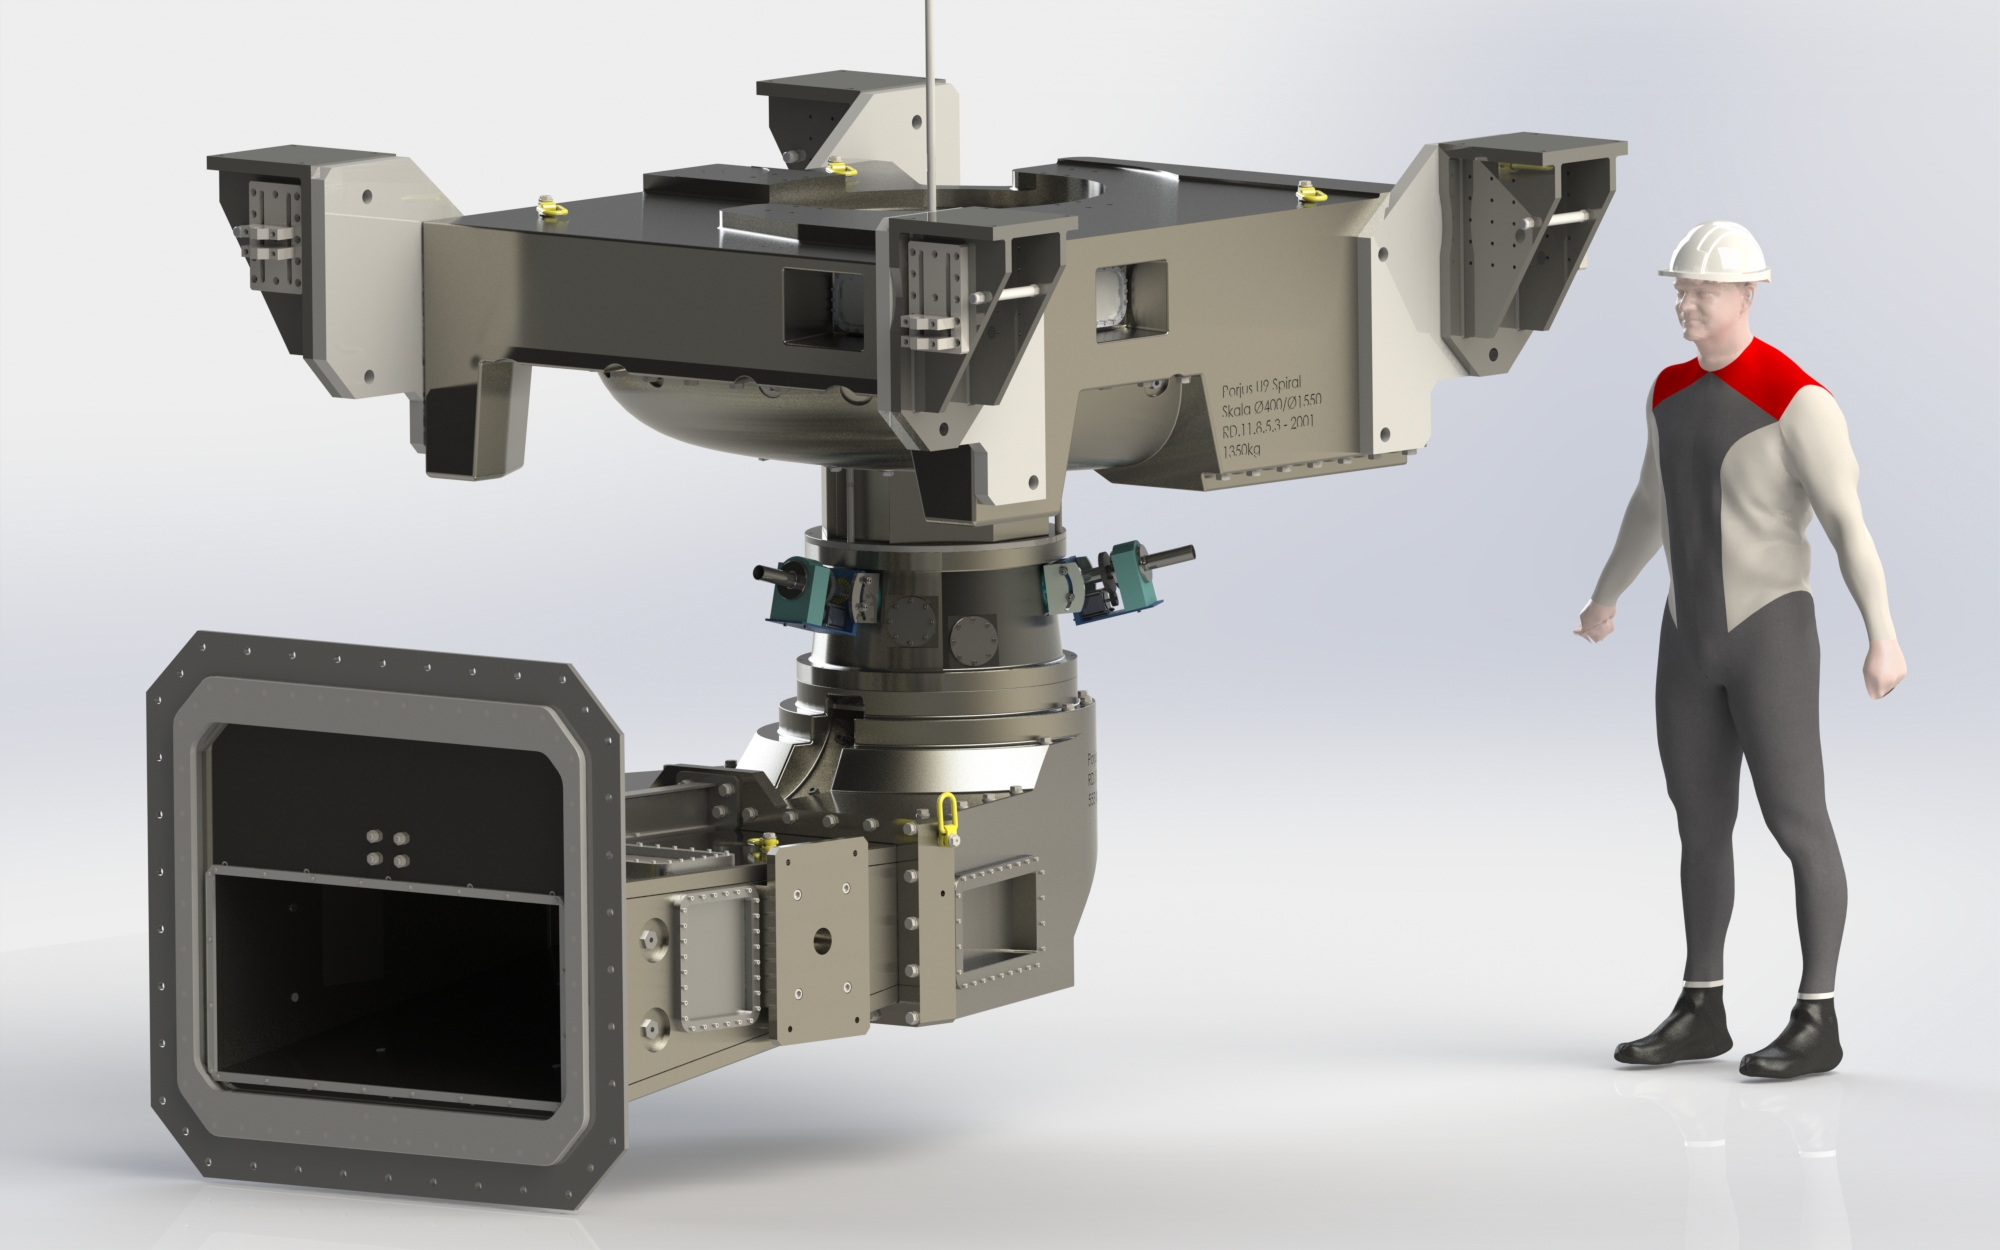
Fig 4 - Älvkarleby Test Rig
Starting from the first two laboratories, we have been developing two different solutions that allow to move the nozzles along the vertical and/or horizontal plane. This in order to meet the AFC4Hydro objective of more degrees of freedom for ICM nozzle motion.
The use of 3D modelling has also been useful to verify a new nozzle design that can perform water injections at different angles by the use of spur gears and stepper motors.
All the components are assembled together in compact and movable injection system units, that have been properly designed in order to be capable of shooting water within the target angular degree range as measured in horizontal plane, into the draft tube.
Once the consistency of the CAD models has been verified, it is simple to provide technical drawings and 3D models to produce each part with accuracy and precision, thanks to different technologies, from machining to 3D printing.
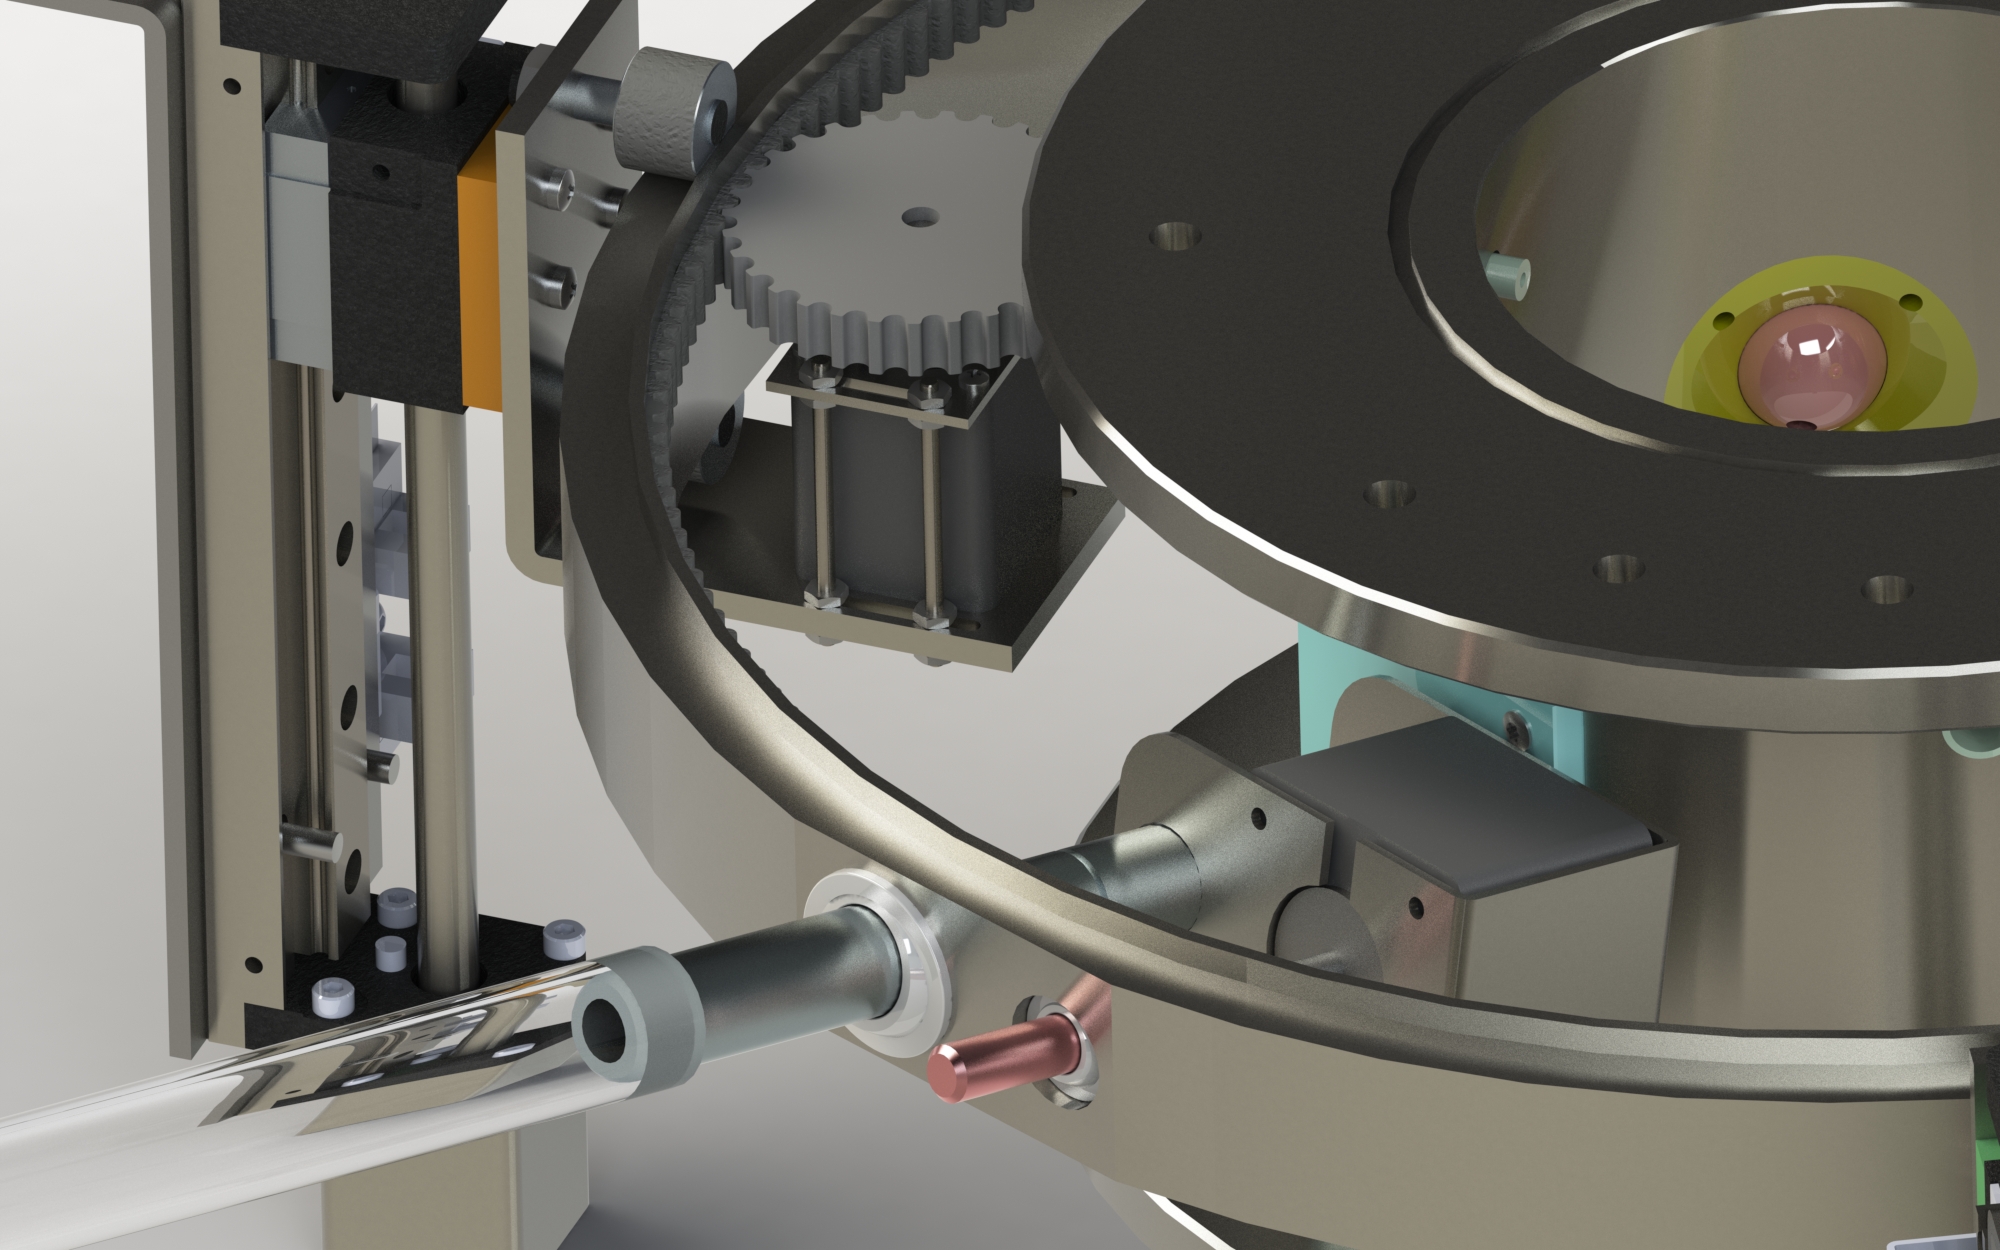
Fig 5 - Luleå detail, ICM design solution
07.01.2021
Using milli-Kelvin accuracy to determine hydroturbine performance
By Morten Kjeldsen, Managing Director, Flow Design Bureau AS, Norway
A part of the AFC4Hydro project aims at developing the start of a CEN/CENELEC standard for aiding new AFC4Hydro type technologies to market. While introducing new technology the impact on overall hydroturbine performance defines one of several success factors. Fortunately, and within the hydropower business, a standard already exists for the determination of hydroturbine efficiency which is the main measure for unit performance. This is the IEC 60041:1991 (IEC41). FDB, one of the partners of AFC4Hydro, performs measurements according to IEC41.
One method when determining the hydraulic efficiency (hHydr) of a hydroturbine uses the measured temperature difference up and downstream the unit. The argument being that losses through the unit manifest as an increase in temperature of the water. A first approach states that when the total unit head (∆H) is lost and dissipated as heat the following relation exists between potential energy and the increase of temperature: 𝑚 ∙ 𝑔 ∙ ∆H = 𝑚 ∙ 𝑐𝑝 ∙ ∆𝑇. Given that the heat capacity (cP) of water equals roughly 4200 J/(kg*K), the temperature increase (∆𝑇) for a ∆H =428m head unit calculates to ∆𝑇=1K when the gravity (g) equals g=9.81 (m*s-2). 428m is a typical design value for a high head Francis unit. Given that hydraulic efficiencies reach 95% the thermometers therefore need to capture a temperature difference of 50mK (or 0.05K).
Thermodynamic Method
The method for determining hydraulic efficiency by measuring the temperature difference (∆𝑇) is usually termed the “Thermodynamic Method”. The IEC41 outlines procedures on how to complete and how to determine the accuracy of such measurements. The same standard outlines how to utilize other methods for determining overall efficiency. One class of methods approaches the problem by a direct measurement of the flow rate (Q) through the unit. The known measured flow allows the calculation of the total head: Δ𝐻 = ℎ𝑆𝑡𝑎𝑡 +(1/2𝑔)*(𝑄/𝐴)2 . When combining DH with the measured generator power (PGen) the hydraulic efficiency then calculates directly as:
𝜂𝐻𝑦𝑑𝑟 = 𝑃𝐺𝑒𝑛/[(𝜌∙𝑄)𝑔∙Δ𝐻] .
For the “Thermodynamic Method” the procedure gives, and in addition to the efficiency, an accurate determination of the flow rate (Q). The relations read as follows:
𝜂𝐻𝑦𝑑𝑟 = 1−(𝑐p∙Δ𝑇)/(𝑔∙Δ𝐻) & 𝑄=𝑃𝐺𝑒𝑛/(𝜌𝑔∙Δ𝐻−𝜌𝑐p∙Δ𝑇).
Note: the total head (∆H) is a function of Q2, and solving for Q requires an iteration scheme. In addition, the value of the generator efficiency is here taken to be 1.0.
An efficiency measurement based on the Thermodynamic Method requires several high accuracy and calibrated sensors in addition to readings from secondary sources. FDB participates together with Hafslund-ECO, a major power utility in Norway, in the maintenance of a joint equipment pool for measurements using the Thermodynamic Method. One objective in this collaboration is to acquire all necessary input simultaneously and to provide a continuous update of results during measurements and thereby maximizing control and quality during testing. This is achieved by connecting the different measurement locations in a LAN, control the data acquisition from one location within the power plant, and include the necessary calculation algorithms in the acquisition software. Still outmost care needs to be taken when managing especially thermometers and pressure transducers before, during and after the measurements.
The pictures below show the upstream probe containing
the thermometer and hydraulic connections for measuring pressures, and a “valve tree” used for connecting hydraulic lines to pressure transducers, aeration before measurements and for comparing the different pressure transducer at similar pressure before and after measurement.
Fig 1 - the upstream probe containing the thermometer and hydraulic connections for measuring pressures,
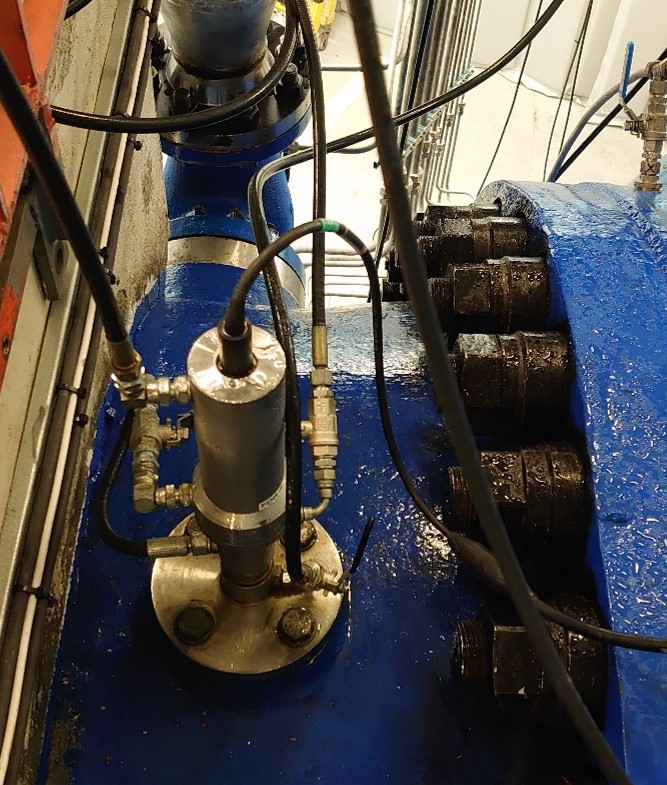
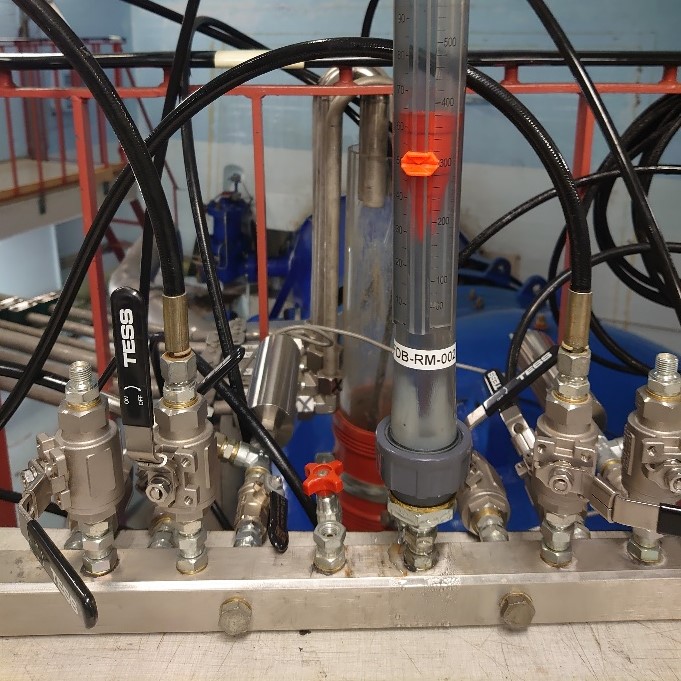
Fig 2 - "valve tree” used for connecting hydraulic lines to pressure transducers, aeration before measurements and for comparing the different pressure transducer
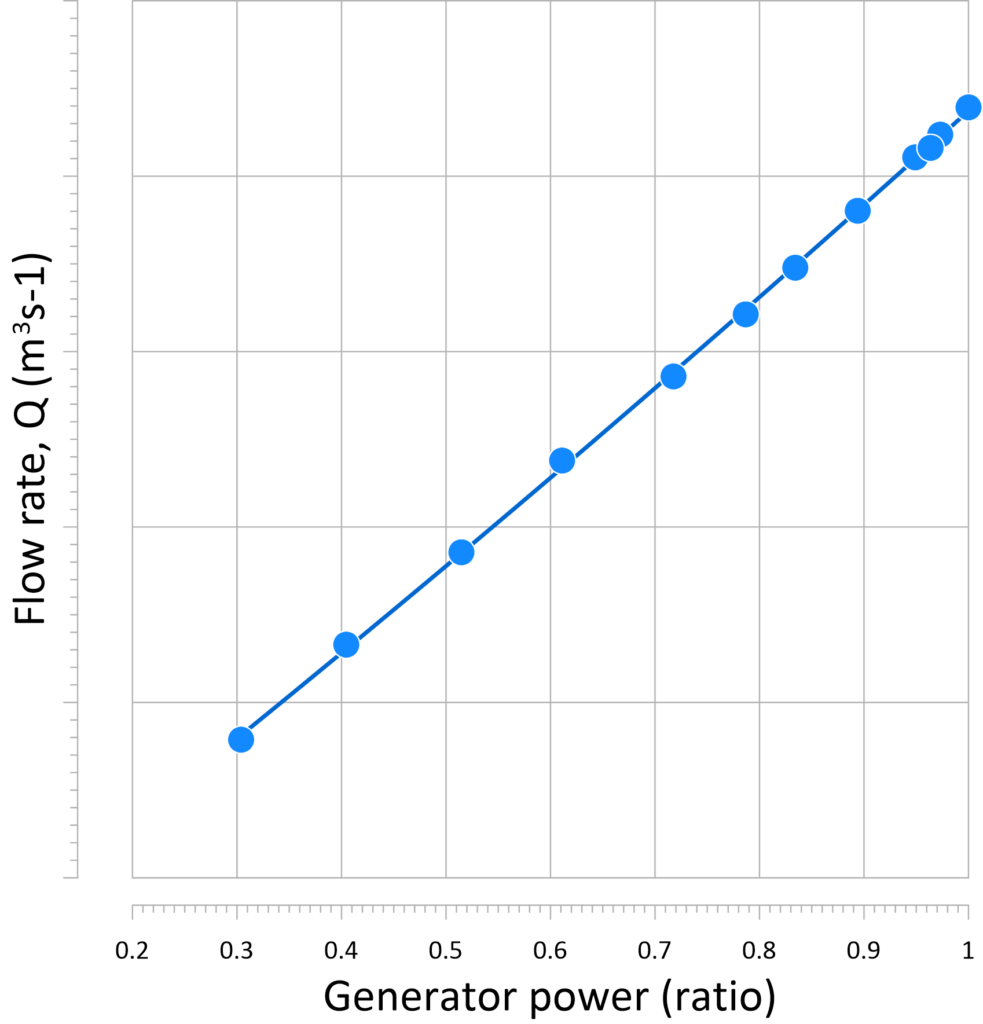
The typical measurement can take up to two days. The units need to be shut down and de-pressurized since the probe shown above and which is the one that facilitates temperature and pressure readings, needs to be installed into the pipe cross-section upstream the unit. Once everything is in place anywhere between 10 and 20 minutes are spent at each operation point. Normally data acquisition is made for 8 to 12 points of unit operation, and usually with several numbers of measurements close to the “Best Efficiency Point”. The graphics below show a sample of measured temperature difference and calculated flow rate from a typically Norwegian high head Francis turbine unit. The unit is anonymized.
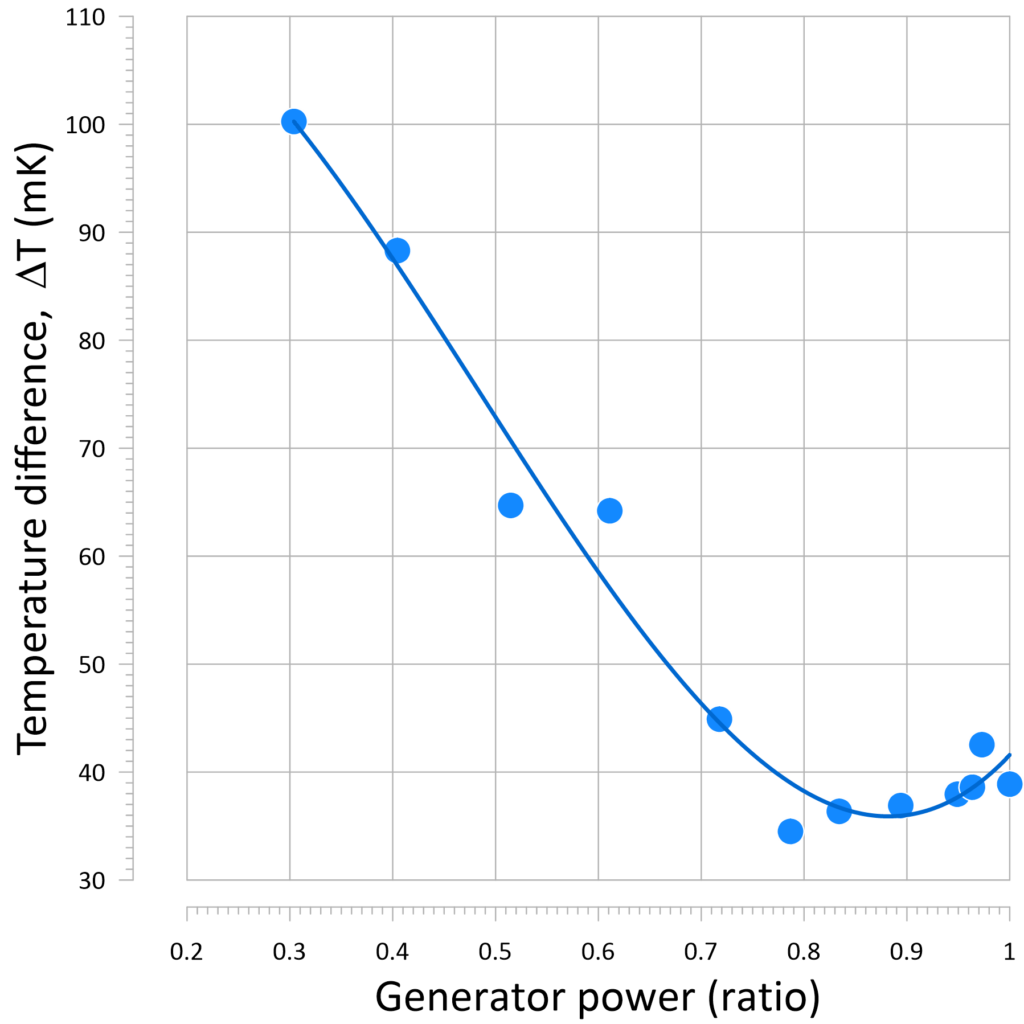
Fig 3, 4 - sample of measured temperature difference and calculated flow rate from a typically Norwegian high head Francis turbine unit
The impact of technologies exploited in AFC4Hydro on overall hydroturbine unit performance will be evaluated by measuring the hydraulic efficiency. Testing at hydraulic laboratories, such as LTU and Vattenfall- Älvkarleby, use flowmeters but also direct measurement of the torque transferred by the turbine impeller to the rotating shaft to determine performance. Model scale performance testing is covered by another IEC standard; namely IEC60193:2019. The final validation of AFC4Hydro technologies will be made at the Oksla power-plant. Oksla is a typical high head Francis unit and for this specific plant the use of efficiency measurements based on the Thermodynamic method will be applied. The procedure for accepting new AFC4Hydro-type technology in existing hydropower solutions will be a major part of the standard work of AFC4Hydro. The planned new standard refers to IEC41 for investigation of the overall impact.
11.10.2020
3D Printing in Hydraulic-Machinery Research
By Joel Sundström, Postdoctoral researcher, Luleå University of Technology, Sweden
In a previous blog post, it was discussed how AFC4Hydro and its participants benefit from computational fluid dynamics simulations (CFD). In this blog post, we will discuss another tool that AFC4Hydro benefits from; namely, 3D printing.
Fig 1 - 3D CAD figure of the test facility at LTU
At LTU, studies of vortex breakdown and the RVR has been ongoing since 2015 through different small student projects. An existing turbine rig for an undergraduate course in which students performed turbine performance tests was modified to investigate the RVR, and potential methods to mitigate it. During the initial experimental studies, no RVR could be found in the draft tube with the original design, and independent of turbine operation. It was not until a group of students who performed their master’s thesis conducted CFD simulations that it was realized that the water passage between the guide vanes and runner blades of the existing rig was ill-designed. The water passage together with a new runner were re-designed by means of CFD and finally 3D printed. With this new configuration, an RVR experiencing both rotating and plunging modes was observed in the draft tube, highlighting the powerful combination of CFD and 3D printing.
To support the development of different mitigating strategies within AFC4Hydro, a test rig has been developed at LTU. The new test rig will allow a better repeatability of the measurements and detailed investigations of the flow. Most of its part have been designed using numerical methods, and selected parts will be 3D printed, including a flow straightener and the turbine runner. Being able to 3D print the runner presents a major advantage over standard milling methods because of the complexity of the blades shape. In addition, the cost will be significantly lower, particularly taking into consideration that multiple runners, with different blade angles, will be printed to mimic an adjustable blade turbine. Other parts such as the draft tube cone have also be 3D printed to decrease time between numerical design and experimental testing.
Model testing has played a crucial role in the development of hydropower during the last 100 years. These tests provide detailed information about turbine performance, cavitation properties etc. that can be hard to obtain at a full-scale machine; however, these tests are associated with a high cost. Optimizing a turbine runner configuration, for example, can also be a time-consuming task if at each design step one has to send the runner for manufacturing. On the other hand, if one has access to 3D printing technology, a new design can be realized rapidly with the auxiliary benefit of being significantly cheaper.
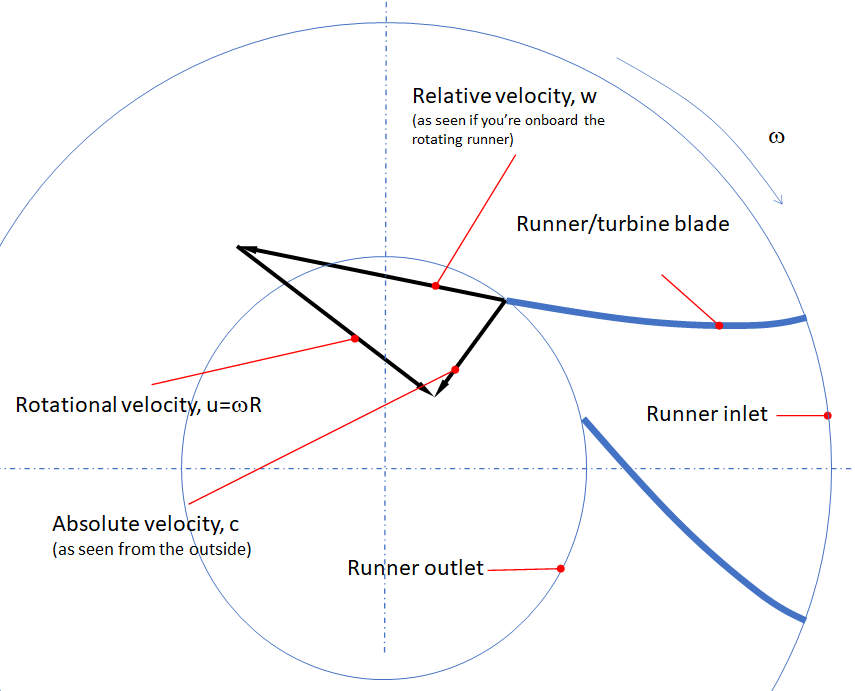
Fig 2 -Velocity diagram figure
3D printing and teaching
3D printing is also useful when it comes to teach students about hydropower. The way that Francis turbines are typically introduced involves a rather abstract two dimensional drawing of velocity triangles shown in the left figure below. Students usually comment this figure like “I don’t understand the figure”. Being able to show students a 3D printed Francis turbine as seen on the right figure below, and from that explain the flow through the turbine considerably simplifies the exposition and thus works as an indispensable asset to increase their understanding.
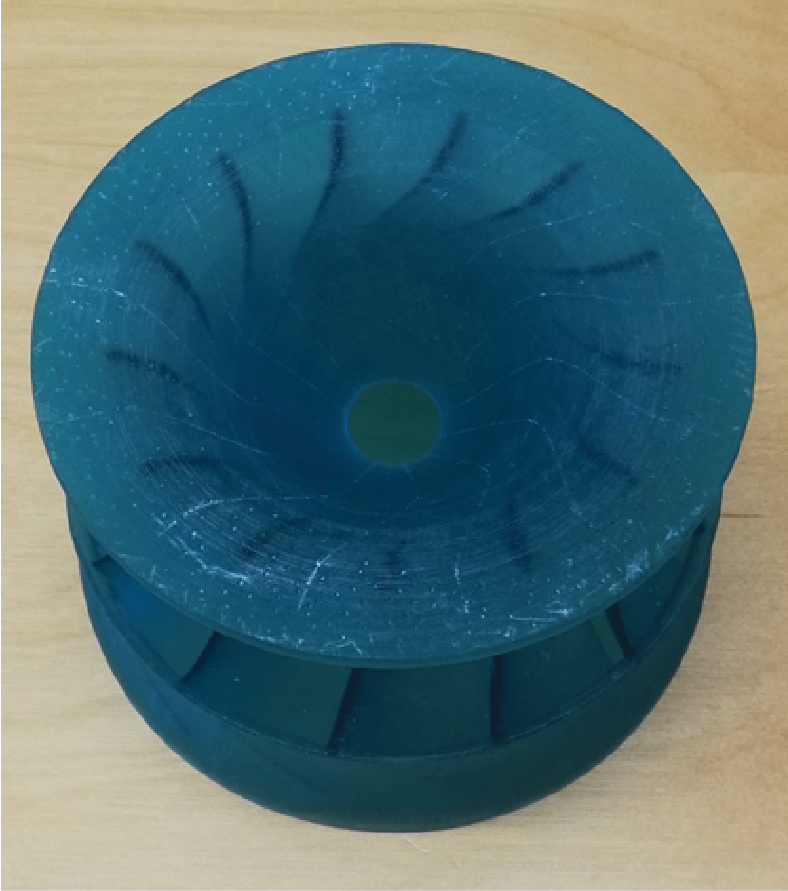
Fig 3 - 3D printed turbine
07.09.2020
About the AFC4Hydro video
By Morten Kjeldsen, Managing Director, Flow Design Bureau AS, Norway
The AFC4Hydro video addresses some of the motivations for the continued development of novel solutions for the hydropower business and therefore of the reasons for the existence of EU sponsored projects such as AFC4Hydro.
In the video certain assertations are made and this blog-post follows up by providing the necessary references and introduction to the number crunching.
Fig 1- The AFC4Hydro introductory video. About the video: Editing was provided by Capix, Stavanger, Norway and Phil Durnford provided the voice-over. The video of Tyssedal hydropower museum was made available by Dag Endre Opedal@Kraftmuseet.
On energy production
The main reference used is the “Energy Statistical Pocketbook 2019” published by the European Commision. Data from “Statistics Norway” adds the contribution of Norway. The electricity production in Europe is annually about 3300 TWh, or 3300 billion kWh, while Norway produces about 147 TWh annually. Renewables constitute about 1000 TWh (Europe) and 144TWh (Norway), and the share of hydropower is about 330 TWh (Europe) and 138 TWh (Norway). As will be explained below hydropower can have added value in addition to being a source of energy production.
On driving cars on renewable energy
It seems to be a consensus that electrical vehicles require on average about 15kWh per 100km. From this point some mathematics can be applied. If all hydropower electricity in Europe is used to propel cars the expression would be (330 + 138) billion kWh annually divided by 15 kWh per 100km. The result becomes 31 billion times 100km annually, or 3100 billion km per year. The latter number corresponds to about 715 round-trips between the orbits of Earth and Neptune! The number of cars in Europe is about 280 millions, and when dividing 3200 billion km by 280 million the result shows 11100 km per car every year i.e. more than the 10000 km cited in the video.
On need for flexibility
Nordpool (https://www.nordpoolgroup.com/) offers services related to power trade but also keeps historical and available statistics related to power trades within and between countries. Using their web-based service, the number for consumed and produced energy per hour at a given week for Norway is downloaded and displayed, see the Graphics below. Although wind is starting to have an impact in Norway, most of the electricity production is by hydropower. As can be seen in the Graphics, a variation during any given day exists. Isolated for Norway a match between produced and consumed power is rarely found. This discrepancy is due to import/export of electricity with neighboring countries. The production in Norway, for the period shown, is at about 70% (about 35GW total installed Hydropower capacity) and changes in production are in the tenths of percentage points over a few hours. This limited data set illustrates that power generation needs to adapt to variation in consumption, to non-variable power sources such as wind and solar feeding the grid, but also to disruptions, such as trips for larger thermal or nuclear power units. Reservoir based hydropower, with its relatively rapid ramping of power setting, plays a key role in compensating for short term discrepancies between produced and consumed power.
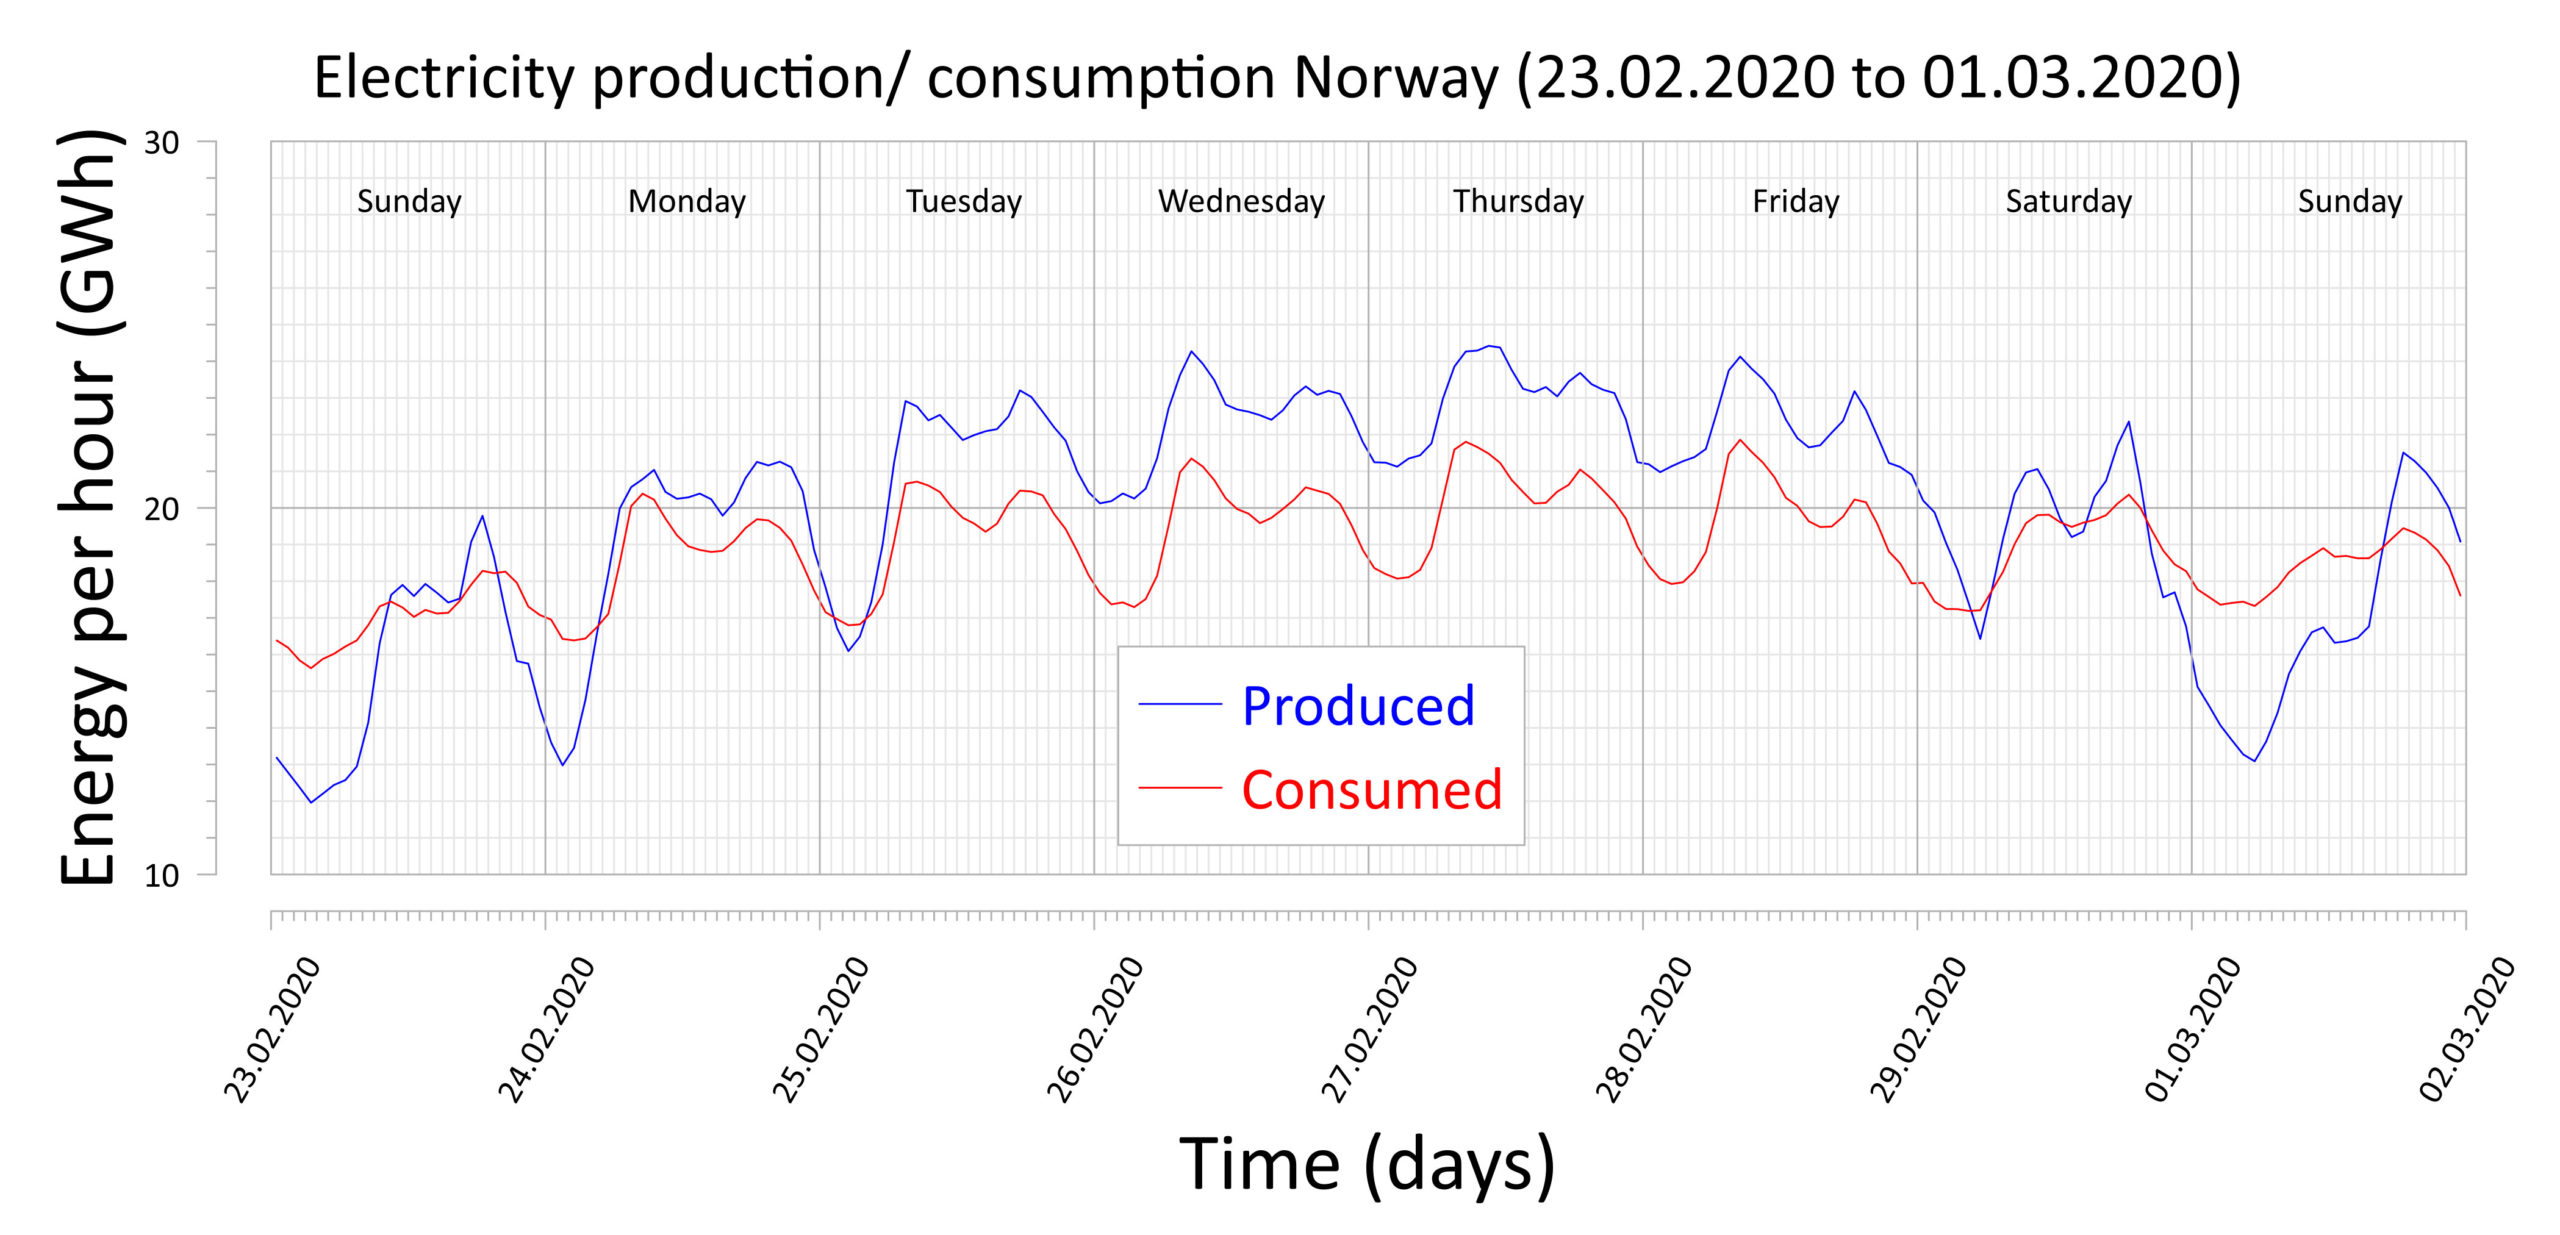
Fig 2- Production and consumption of electricity per hour for a week in February 2020. Data from Nordpoolgroup.com
On cost of flexibility
As stated in the previous section the hydroturbine units have a high flexibility although with a cost. By nature, hydroturbines are designed to have an optimum performance in a limited power range around the best efficiency point. Once outside of this range the efficiency drops and deleterious effect such as cavitation and excessive pressure can appear. Below a graph tries to summarize these effects and consequences. The AFC4Hydro, and similar, technologies try to rectify this by mitigating deleterious effects and improve efficiencies for all power settings. This way AFC4Hydro, and similar projects, contribute to continue development and improvement of hydropower as a beneficial source of energy and power in the European energy mix. The project aims at technologies that can be retrofitted into existing units, but similar technologies will likely be included with new unit deliveries.

Fig 3 - A busy graph that shows acceptable and unacceptable cavitation and levels of pressure pulsation and corresponding allowable operating range, and efficiencies before AFC4Hydro type technologies. The operating range and efficiencies are expected to improve when the technologies are applied.
On AFC4Hydro sites
One minutes into the video a drone is flying over Sørfjorden and shows the Tyssedal hydropower museum. The entrance to the Oksla powerplant, where AFC4Hydro technologies will be validated, is very close to this building. In addition, activities on actual turbine units will take place in Porjus and Älkvarleby.
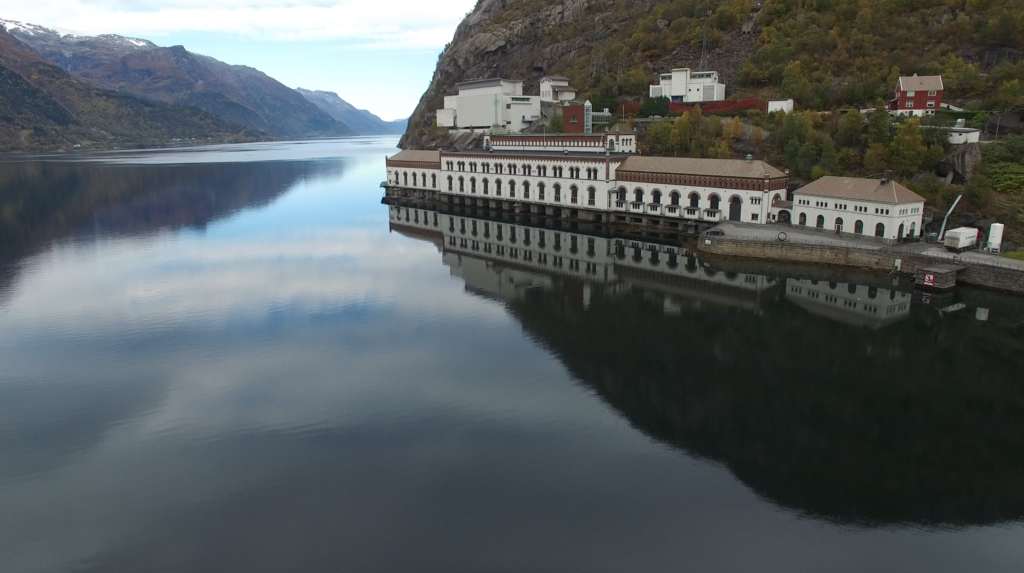
Fig 4 - Tyssedal hydropower museum
22.06.2020
Fluid Structure Interaction
By Rafel Roig Bauzà , PhD student, Universitat Politècnica de Cataluny
Fluid Structure Interacion (FSI) is a multiphysics problem to be solved when a structure vibrates within a fluid. For that, the coupling of the laws describing the structural mechanics and the fluid dynamics must be considered. This phenomenon is relevant when interactions between a deformable or moving structure and an internal or surrounding fluid flow are affecting both fields.
What is FSI used for?
FSI can be used, for instance, to study the structural deformation of a solid body (stresses and strains) when it is submerged in a flow (velocities and pressures) and vice versa.
FSI is present in most engineering fields:
- Aeronautics
- Hydraulic machinery
- Biofluids
- Offshore structures
- Piping systems
Fig 1- CAD image of the fluid (transparent) and Structural (brown) domain
Fig 2- Structural mode shap
What are the most common approaches?
Historically, the main approaches used to study FSI phenomena have been experimental and theoretical. However, the availability of economical and powerful simulation tools and equipment has given engineers and researchers the opportunity to approach this problem using numerical tools.
Here below we briefly present the different numerical methodologies based on the level of complexity to approach FSI problems:
• Coupled Acoustic Structural FEM
In this approach small but fast structural deformations (vibrations) lead to pressure waves in the fluid medium which is considered to be still. In this case, the coupling is bidirectional since the pressure waves also determine the body vibrations.
• One-Way FSI
This approach is used when small and slow structural deformations do not affect the fluid flow. So, the hydraulic loads induced by the flow on the body are simulated assuming a rigid boundary and then applied to the structure to determine its deformation.
• Two-Way FSI
This approach is used when large structural deformations lead to significant changes on the fluid pressure and velocity fields. Therefore, the coupling is bidirectional which means that both the fluid flow affects the structure deformation and the structure deformation affects the fluid flow.
Fig 3- Francis Turbine Runner
Role of FSI in AFC4Hydro
As it has been explained, FSI is present in most engineering problems and the AFC4Hydro project outcome is not an exception.
To understand the dynamic response of a hydraulic turbine under different operation conditions, AFC4Hydro relies on both numerical and experimental FSI analysis. In particular, One-Way and Coupled Acoustic Structural FEM numerical approaches will be used.
17.04.2020
A bouquet of reasons for applying CFD
By Morten Kjeldsen, Managing Director, Flow Design Bureau AS, Norway.
AFC4Hydro relies on numerical analysis and Computational Fluid Dynamics (CFD) both for increasing our understanding of the root problem and for designing optimal solutions that mitigate the same problems. As for AFC4Hydro partners, CFD has a strong foothold in research and engineering groups both within academia and industry dealing with flow systems. This blog-entry discusses reasons for using and when to use CFD.
WhY cfd?
1 The first reason given is Evaluation and optimization of designs and typically at an early stage when developing solutions. For a CFD engineer this is the dream scenario and tools for parametrization of geometry and design and optimizing software can be employed. A pitfall at this stage can be the omission of secondary flows that has a profound impact on the performance of the final and realized system, and incorrect boundary conditions when evaluating performance. The alternative to CFD at this stage is usually experimental investigations. Historically the experimental approach has been considered expensive and time consuming, but with the advent of 3D printing the model scale physical testing might be revived and become a competitor but also a companion to CFD works.
2 The next reason for doing CFD is to Substantiate and visualize the solution. Results from 3D CFD is highly visual, and to the point that some claims the “C” in CFD is an abbreviation for colorful! But it is a fact that this visualization is powerful and assists both in understanding and for communication. The visualization can be used for engaging the end client, to achieve acceptance for a selected concept and even for pure marketing purposes.
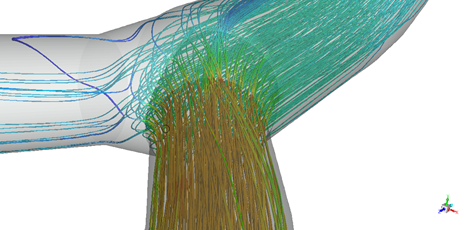
Fig 1- CFD visualization of flow through a Y- junction in a hydropower plant.
3 Once a design or concept is settled, and even physically exists, other reasons for CFD emerge. One typical task is Documentation of performance. In most commercial deliveries the equipment is expected to meet a minimum performance for typical operating conditions of the whole system. Instead of creating a rigid test regime CFD can be used to extrapolate existing data. These results can then be used for a complete documentation of performance and provide input for control solutions. In the extreme case CFD can be used for Verification of conditions not possible to achieve during e.g. factory acceptance test. A typical task would be to calculate performance for conditions exceeding the range used during design.
4 The final reason given is Troubleshooting of system performance. Often system performance failure occurs in interfaces between different products and sub-systems, although the degraded performance is experienced mostly in one specific sub-system or component. Usually the supplier of the component experiencing the trouble is given the task of investigation, but this is also the time when an independent party can enter the stage. Troubleshooting, although highly unwelcomed, usually makes the CFD engineer feel more alive! Creativity is needed to establish the root cause of the problem, but also for suggesting solutions to rectify the problem.
Fig 2- Initial, and pre- AFC4Hydro, CFD studies for design of the IPM (WP1) concept. Calculation by Prof. Cervantes at LTU.
An industrial trend is to use CFD as part of the running operation and monitoring of flow systems. This trend materializes in terminology such as digital twin, reduced-order-models and edge-computing, and is a trend characterized by the blend of sensor input and on-site numerical simulation.
AFC4Hydro is present in most stages for the use of CFD, although we try to avoid a trouble shooting scenario!
The final test of AFC4Hydro technologies will include the use of digital twins as part of the active flow control (AFC). On the other hand, the main tasks of AFC4Hydro is more about steel, manufacturing, installation in prototype hydro-turbines and on-site presence and testing. Still these tasks are expected to proceed without too many obstacles, and mostly due to comprehensive CFD efforts in the early stages of our H2020 project.
16.03.2020
AFC4Hydro partners contribute to the digitalization wave in hydropower
By Morten Kjeldsen, Managing Director, Flow Design Bureau AS, Norway.
AFC is short for Active Flow Control and implies that information for given states of the hydroturbine operation trigger flow control systems that have a positive impact on instantaneous turbine performance. This process requires sensor input, data acquisition and analysis and a control algorithm. In the bigger picture these process steps coincide with that associated digitalization. All partners of AFC4Hydro contribute to the digitalization of hydropower. This blog entry highlights the digitalization efforts of the partner Flow Design Bureau AS (FDB).
In hydropower plants the typical measurements focus on fiscal and on protective parameters. The former includes reservoir levels and power-production by the generator, while the latter includes vibration or shaft dynamics, and temperature of critical components such as bearings and power-electronics. If protective measures exceed pre-set thresholds the system shuts down. One emerging trend involves the gathering of data for condition monitoring. At this stage a few approaches present themselves: Use of data already available from protective measurement, an Internet of Things approach by adding a high number of data-sources, and finally measurements that allow high fidelity acquisition of specific states of the machinery or system. The latter type measurements also take part in a digital twin philosophy. Another emerging measurement trend challenges existing limitations on operation of the hydro-turbine. Such limitations can relate to cavitation and vibration conditions. In practice the enforcement of these limits base itself on pre-defined permissible load ranges. The continuous measurement of cavitation intensity and shaft dynamics allows to operate the unit on actual unit feed-back and not within a constrained pre-defined range. By constantly challenging load range limitations hydropower continues to be an attractive and a flexible power supplier to the grid.
Most employees at FDB have their engineering degrees doing experimental flow studies. One consequence being an instinctive approach to management of measurement chains consisting of sensors, data acquisition, analysis and presentation of result. FDB also delivers commercial measurements for the hydropower industry. One such measurement is the thermodynamic efficiency measurements. This is an approved and standardized method that also provides an accurate determination of flow rate through the unit. The term thermodynamic refers to the fact that the measurement relies on measuring the temperature increase due to the inefficiency of the unit. The temperature increase measures in the tens of milli-Kelvin, but when performed correctly allows the determination of unit efficiency with error-bands of the order of +/- 1% for each operation point measured.
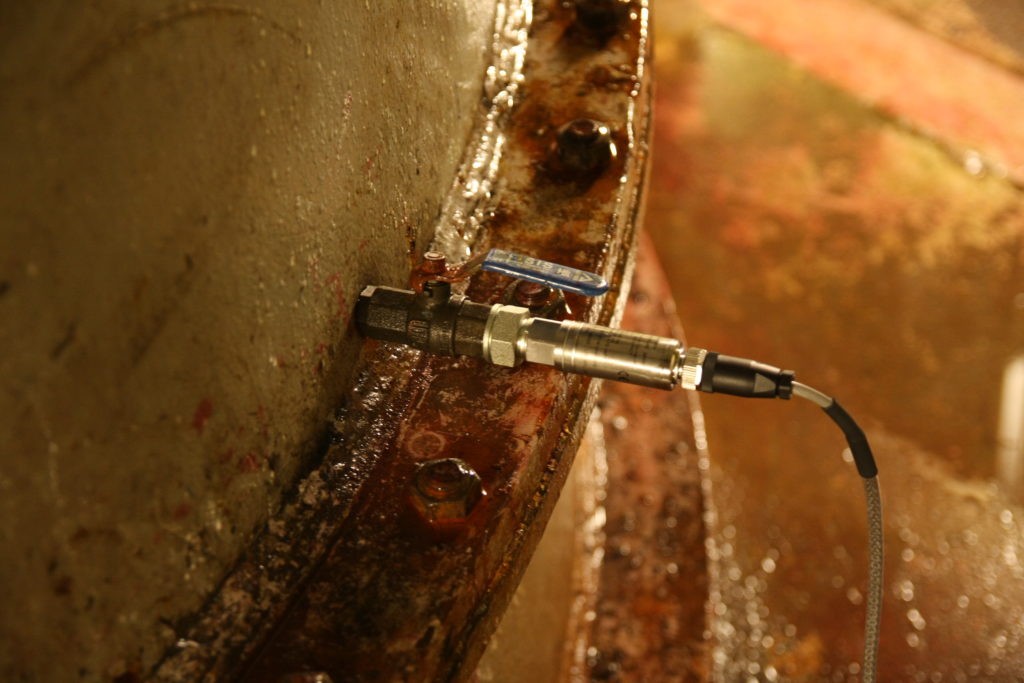
Fig 1- Accurate measurements in an industrial environment. Sensors meet harsh environment giving demands to the sensor itself, mounting and cable routing. FDB assists with all aspects, such as sensor-mounting and cable works, before data acquisition and further processing of signals.
The application of FDB’s knowledge and experience to the current and emerging needs of the Hydropower industry creates an environment for the development of beneficial solutions, services and products. A joint development project with Statkraft, another partner in AFC4Hydro, resulted in solutions such as instruments for cavitation intensity and continuous and real-time efficiency. The same project developed the framework for distributed acquisition of time-resolved data, edge processing and data transfer. The edge processing on the continuous data stream will as a minimum provide statistical data for each sampled channel/ sensor, controlled down-sampling of time-resolved input and investigation of the amplitude for specific and relevant frequencies. Some of these analyses also act as event triggers for the sampling and storing of time resolved data at high time resolution before and sub-sequent the event. The same framework includes several solutions for the transfer of data and results to SCADA systems, historians and general severs. The data produced and gathered will serve as a basis for the evaluation of the current state and trends for wear and tear, but also for developing guidelines for more optimal power production.
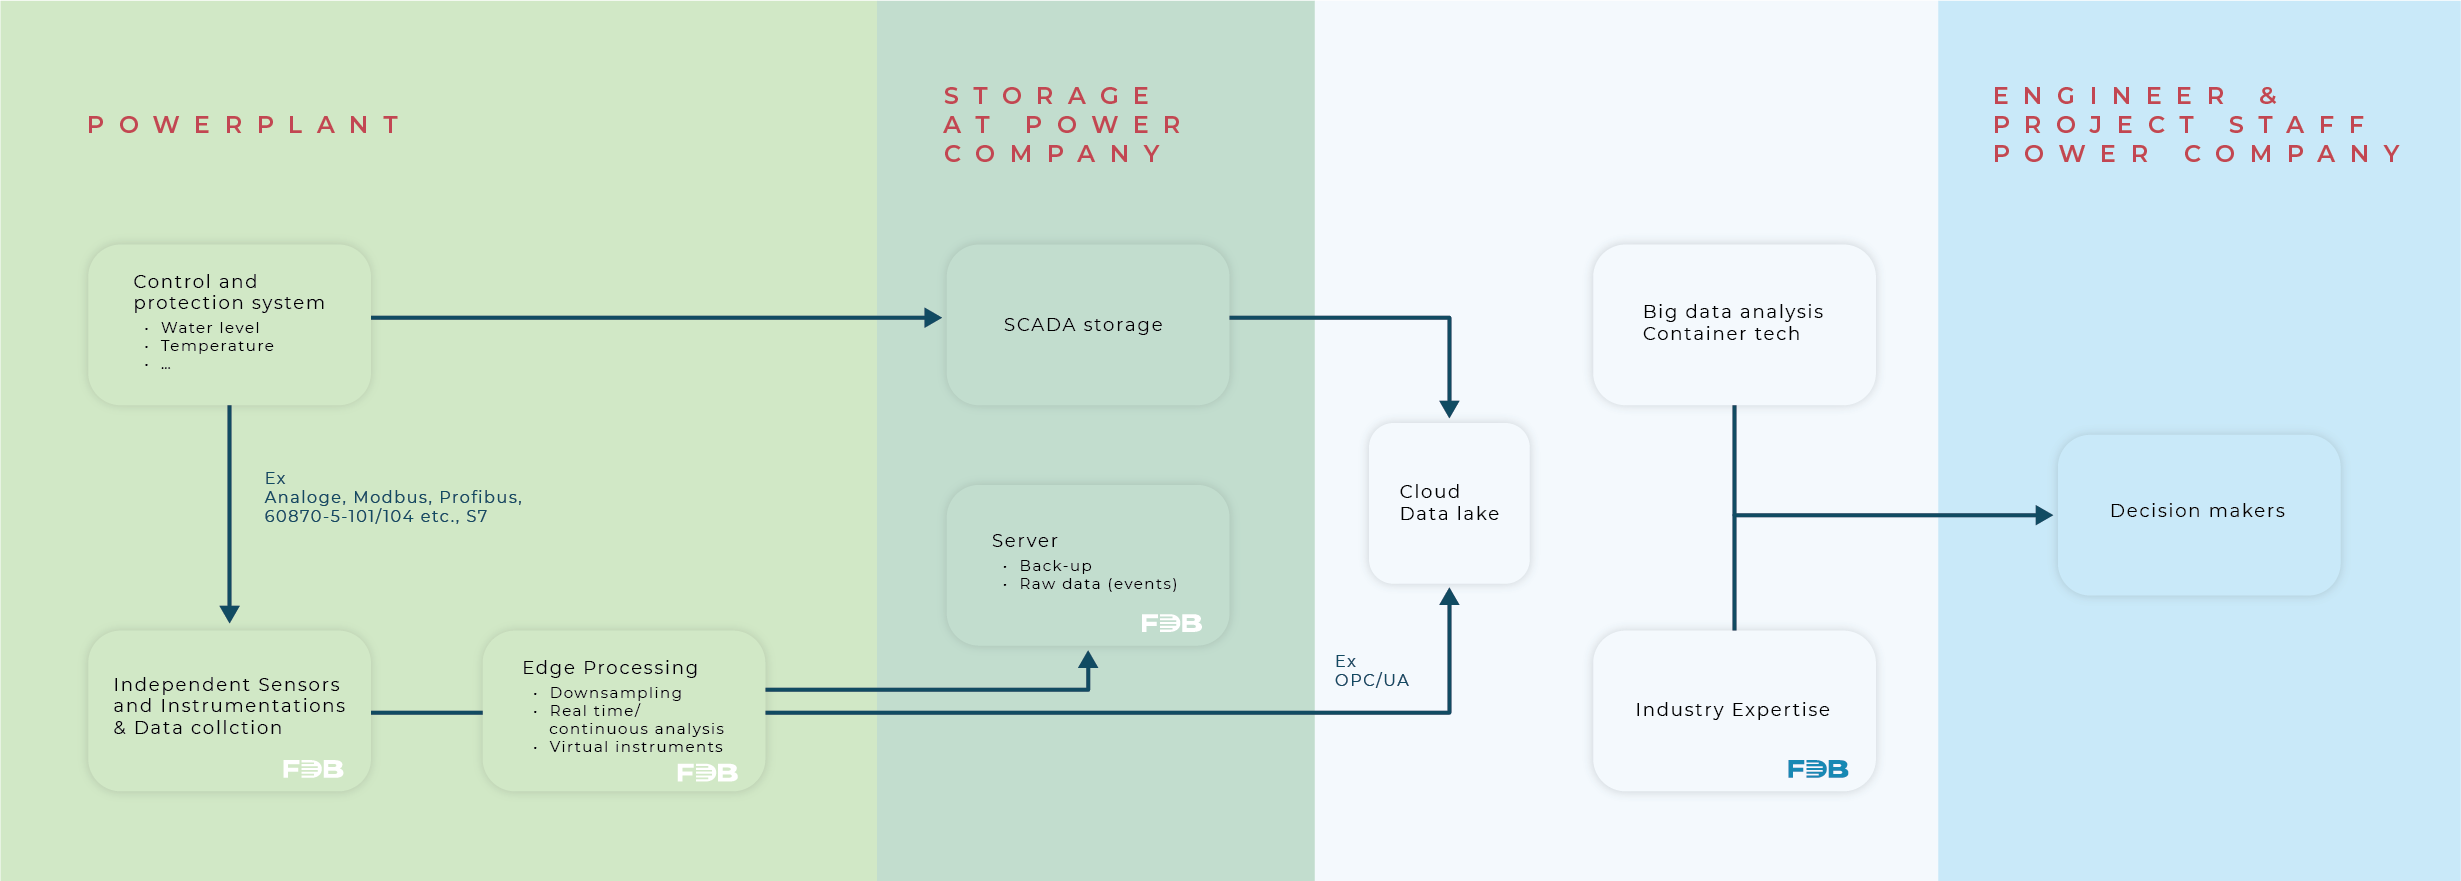
Fig 2- Illustrating the hydropower plant-data value chain. FDB contributes with plant ground work, but also assists in visualizing and presenting data for decision makers at the power company.
Using time-resolved data as boundary conditions in numerical models of the water conduits, shaft-systems or for auxiliary systems such as fluid power systems, expand the knowledge of the hydropower unit or system performance. FDB deploys physical models on edge-processing units and in effect establish virtual instruments that can produce additional and useful information about the hydropower system. An alternative to edge processing involves the transfer of data from hydropower plants to servers running commercial and specialized physical modelling software. The result of these calculations when compared with independent plant data, or data not used as input, acts as a check for normal behavior and can ultimately detect an unwanted state. An established correspondence between this digital model and real plant data gives a confidence and such that the same model or the digital twin can be used for what-if scenarios and for troubleshooting. FDB uses expert user software and have the experience and capability of bringing these tools online.
FDB brings their expertise and experience related to digitalization in an industrial environment into the AFC4Hydro project. Combining this expertise with that of the other partners creates a formidable and very knowledgeable team that can manage most challenges. An important task in AFC4Hydro is to provide maximum knowledge of a unit or system state, but with minimum sensor- usage. This approach requires a superior physical understanding of the systems in question, access to and user knowledge of high level physical modeling software, knowledge of sensors and how to install and implement them in an industrial environment, and edge processing solutions that allow proper analysis of acquired data and control of physical systems to be validated through the AFC4Hydro project.
21.01.2020
AFC4Hydro attended the 72nd American Physics Society (APS)- Division of Fluid Dynamics (DFD) meeting
Seattle Nov 24-26, 2019
By Morten Kjeldsen, Managing Director, Flow Design Bureau AS, Norway.
AFC4Hydro’s Morten Kjeldsen from FDB attended the 72nd APS-DFD meeting. A motivation for AFC4Hydro is to get inspiration and learn from flow control sessions at this meeting. One of the impacts of AFC4Hydro project is to disseminate knowledge about flow control techniques and technologies both generally and for hydropower specifically. By attending this meeting the project also gets a first hand experience of a typical arena for presenting findings from AFC4Hydro.
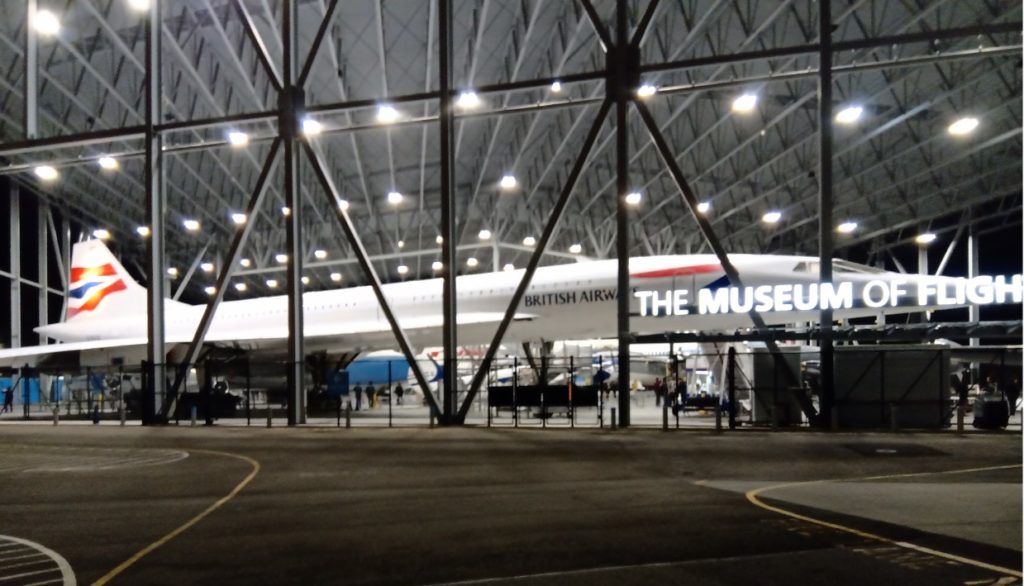
The APS DFD meeting is an annual meeting that takes place in different cities in the US. More than 3000 persons attend these meetings. Most attendants are usually affiliated universities, where the majority originate from the USA but with a fair share from Europe. The duration corresponds to three full days, with as much as 40 parallel sessions. This meeting is also known for its Gallery of Fluid Motion that consists of both poster and video- entries. A reception is also held for the participants and this year the Museum of Flight hosted the event.
The general sessions are dominated by oral presentations of 12 minutes including a 2 minutes discussion. This format forces a presentation with a more focus on motivation, background, status of research and preliminary results. The consequence being that this meeting gives an insight into the status of the various disciplines of Fluid Dynamics. In addition to the general sessions the APS DFD includes invited talks, award lectures and flash-presentations of the abovementioned Gallery of Fluid Motion. The full meeting schedule is available through the conference web site.
During the meeting Kjeldsen went to the following sessions related to flow control: Separated Flows: Control, Drag Reduction, Flow Control: Sensor Placement and Shape Optimization, Aerodynamics: Flow Control, Flow Control: Separation and Flow Control: Turbulence/ Flow Control: Model Reduction. The only contribution that shared similarities with the technologies developed by AFC4Hydro was that by An et al: Dynamic mode analysis and control of vortical flows in pump sumps. The presentation showed an axial jet shooting from the floor of the pump sump and towards the pump intake. This solution mitigates the effects of the swirl experienced by the pump.
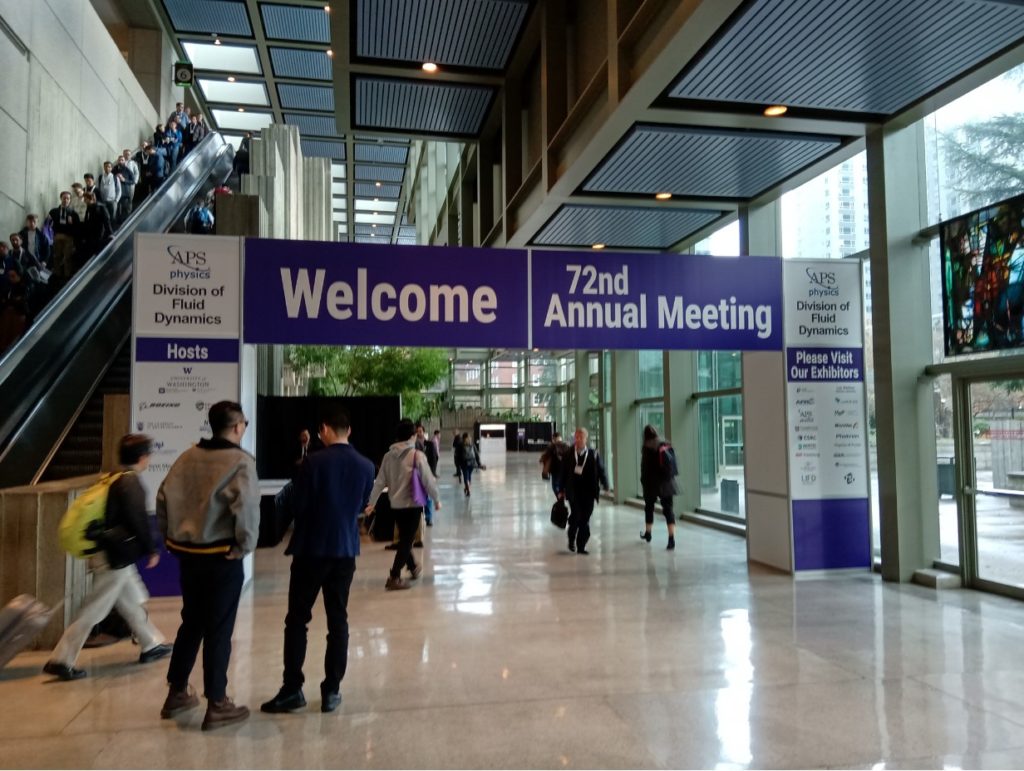
Fig 1- @Washington State Convention center in Seattle. Site of the 72nd APS DFD meeting.
In addition to application of Flow Control, the technologies themselves where scrutinized. Passive solutions, such as shark-skins, were discussed. Semi active control using synthetic jets, suction and blowing were discussed but mostly in an aerodynamic context. These technologies are analogous to those exploited in the AFC4Hydro project. Of special interest was the use of Fluidic Oscillators, which is a way to produce oscillations in the angle of injection for the jets or sweeping jets. This approach is something the AFC4Hydro will evaluate and in relation to use with Hydropower.
The days spent at the meeting proved to be as expected. Lots of impressions and inputs that will benefit the work on AFC4Hydro. As for recommendations of the APS-DFD meeting; if you ever want to be overwhelmed by the share amount of work going on in the field of fluid dynamics, this is the place to go!
Link for technical program: http://meetings.aps.org/Meeting/DFD19/Content/3770